Mechanical Insulation Appraisal · Preliminary Report

Anheuser-Busch Brewery - St Louis MO - Bldg 179

Engineered findings from a NAIMA 3E Plus walk-down assessment. 76 items inventoried across 22 systems · estimated $29,139/yr in recoverable operating cost.

Executive Summary

Overview of identified insulation upgrade opportunities and projected annual savings. This is a Preliminary Report. Please see the 'Line Item Detail' Page for detailed information about each item assessed along with Infrared Imaging. Your EEQA representative will now solicit bids from our Qualified Contractors. Please allow 4-6 weeks for the bidding to complete. Your EEQA representative will then submit to you a Final Report upon it's completion. All completed upgrades will have a Quality Control visit to ensure the Mechanical Insulation was installed in accordance with specifications.

Estimated Annual Savings
$29,139/yr
Energy cost reduction from upgrades
Current Operating Cost
$31,346/yr
Inventoried surface annual cost
Upgraded Operating Cost
$2,207/yr
After insulation improvements
Cost Reduction
93.0%
Operating cost decrease
Heat Flow Reduction
4,487,369kBtu/yr
4,487.4 MMBtu/yr saved
CO₂ Reduction
296.49MT/yr
Metric tons per year
NOₓ Reduction
1310.8lbs/yr
Pounds per year
Items Assessed
76items
Across 22 systems
Annual Operating Cost Comparison
Current (As-Found)
$31,346
per year
After Upgrade
$2,207
per year

Upgrading the insulation on the 76 identified items would result in estimated annual energy cost savings of $29,139/yr, a reduction in heat flow of 4,487,369 kBtu/yr, a reduction in CO₂ emissions of 296.49 MT/yr, and a reduction in NOₓ emissions of 1310.8 lbs/yr. All calculations were performed using the NAIMA 3E Plus (version 5.1) computer program.

Savings Analysis

Energy cost savings by system area, ranked by annual impact.

Annual Energy Cost Savings by System
5-Year Projected Savings
5-Year Energy Savings
$145,695
Cumulative cost avoidance
5-Year Heat Flow Saved
22,437MMBtu
Cumulative thermal savings
5-Year CO₂ Avoided
1482.4MT
Equivalent to ~64 cars off the road/yr
Environmental Impact

Emissions reductions achieved through insulation upgrades.

CO₂ Reduction
296.49MT/yr
Metric tons carbon dioxide
NOₓ Reduction
1310.8lbs/yr
Pounds nitrogen oxides
Equivalent Cars Removed
~64/yr
Based on avg 4.6 MT CO₂/car/yr
Heat Flow Saved
4,487.4MMBtu/yr
Thermal energy conserved
CO₂ Reduction by System
System Breakdown

Summary of each system/equipment group.

SystemItemsCurrent $/yrUpgraded $/yrSavings $/yrHeat kBtu/yrCO₂ MT/yrNOₓ lbs/yr
Line-Item Detail

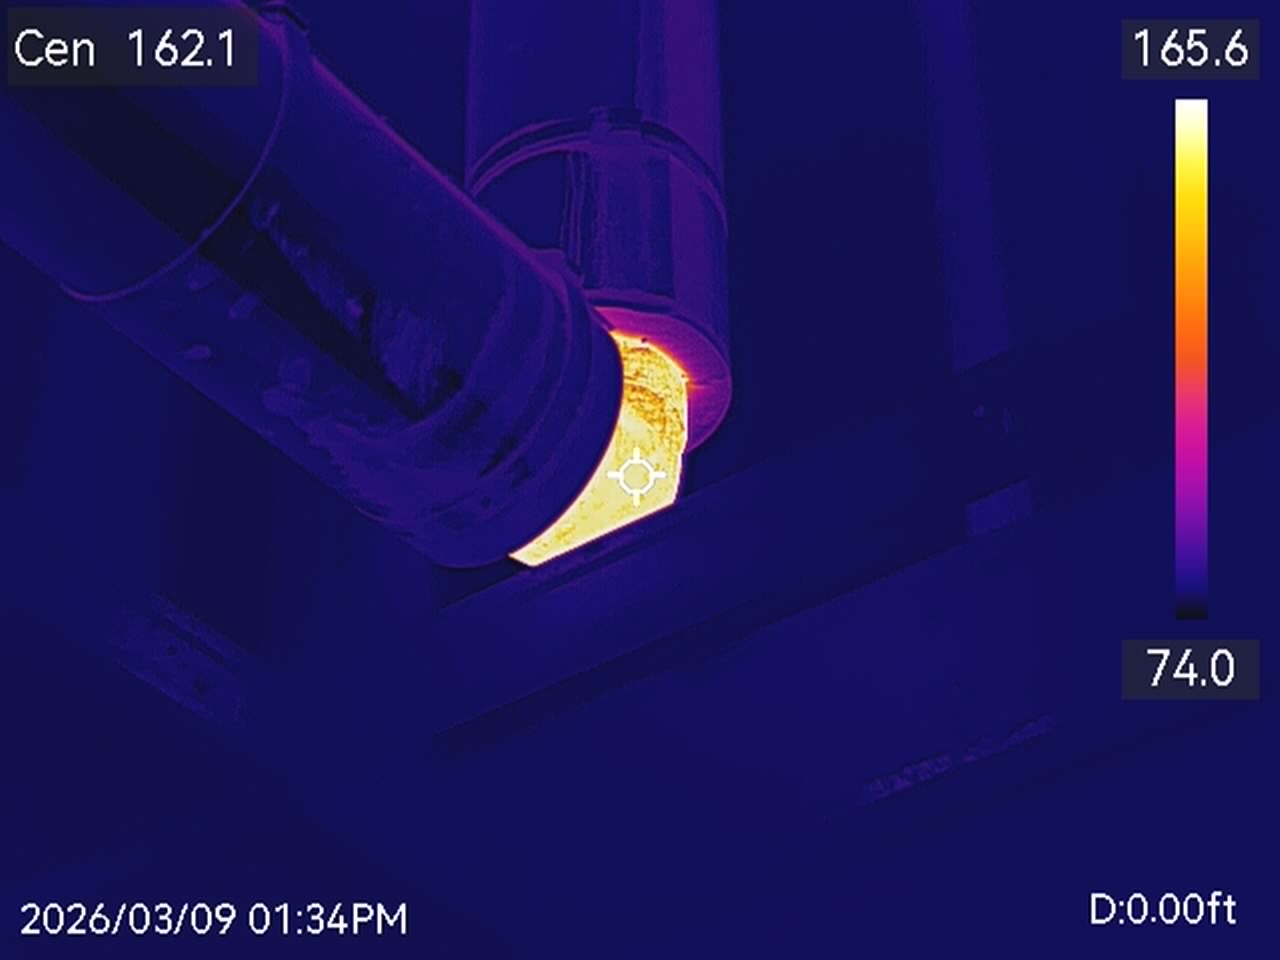
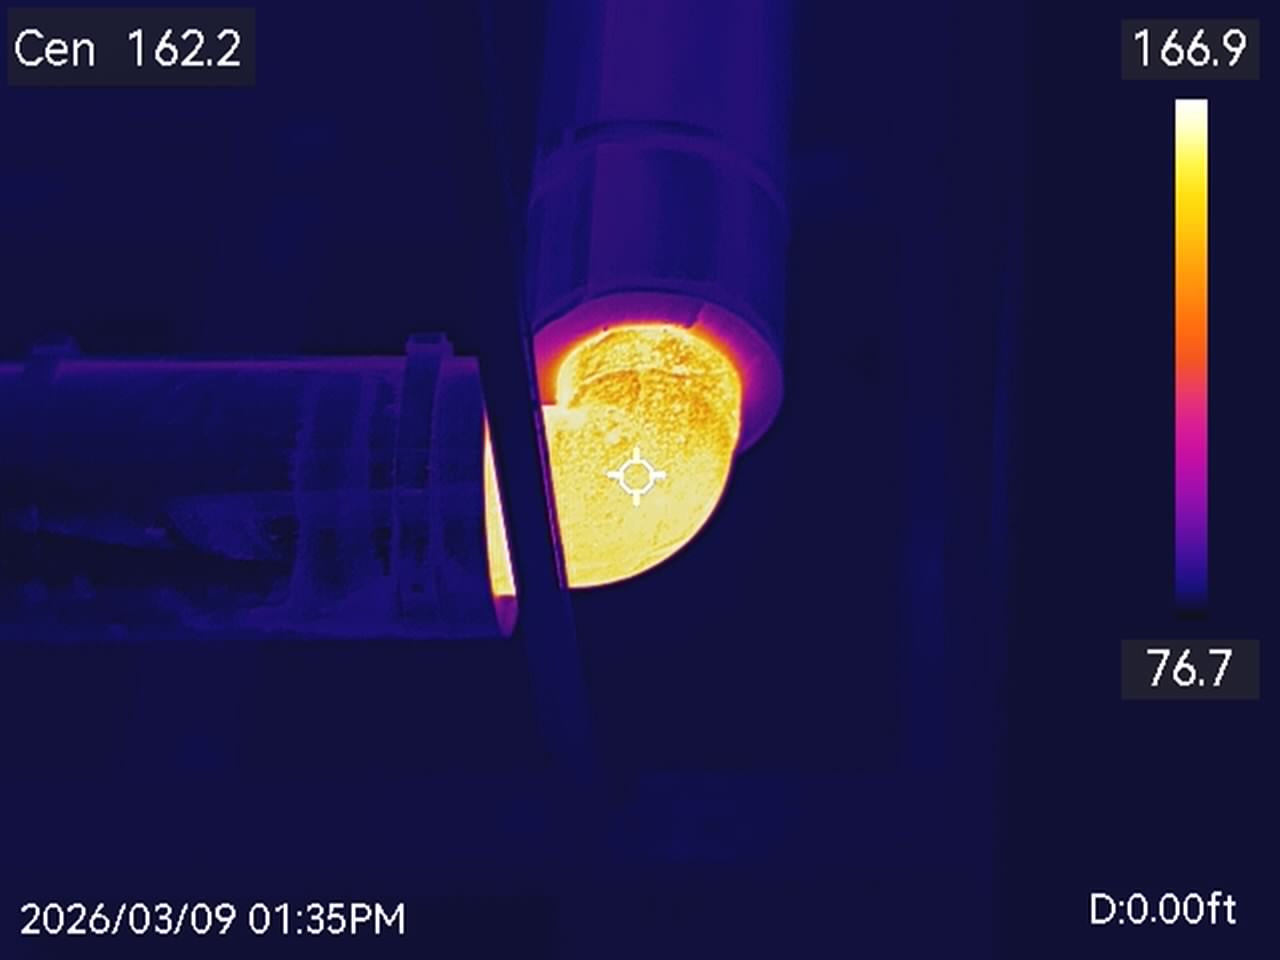
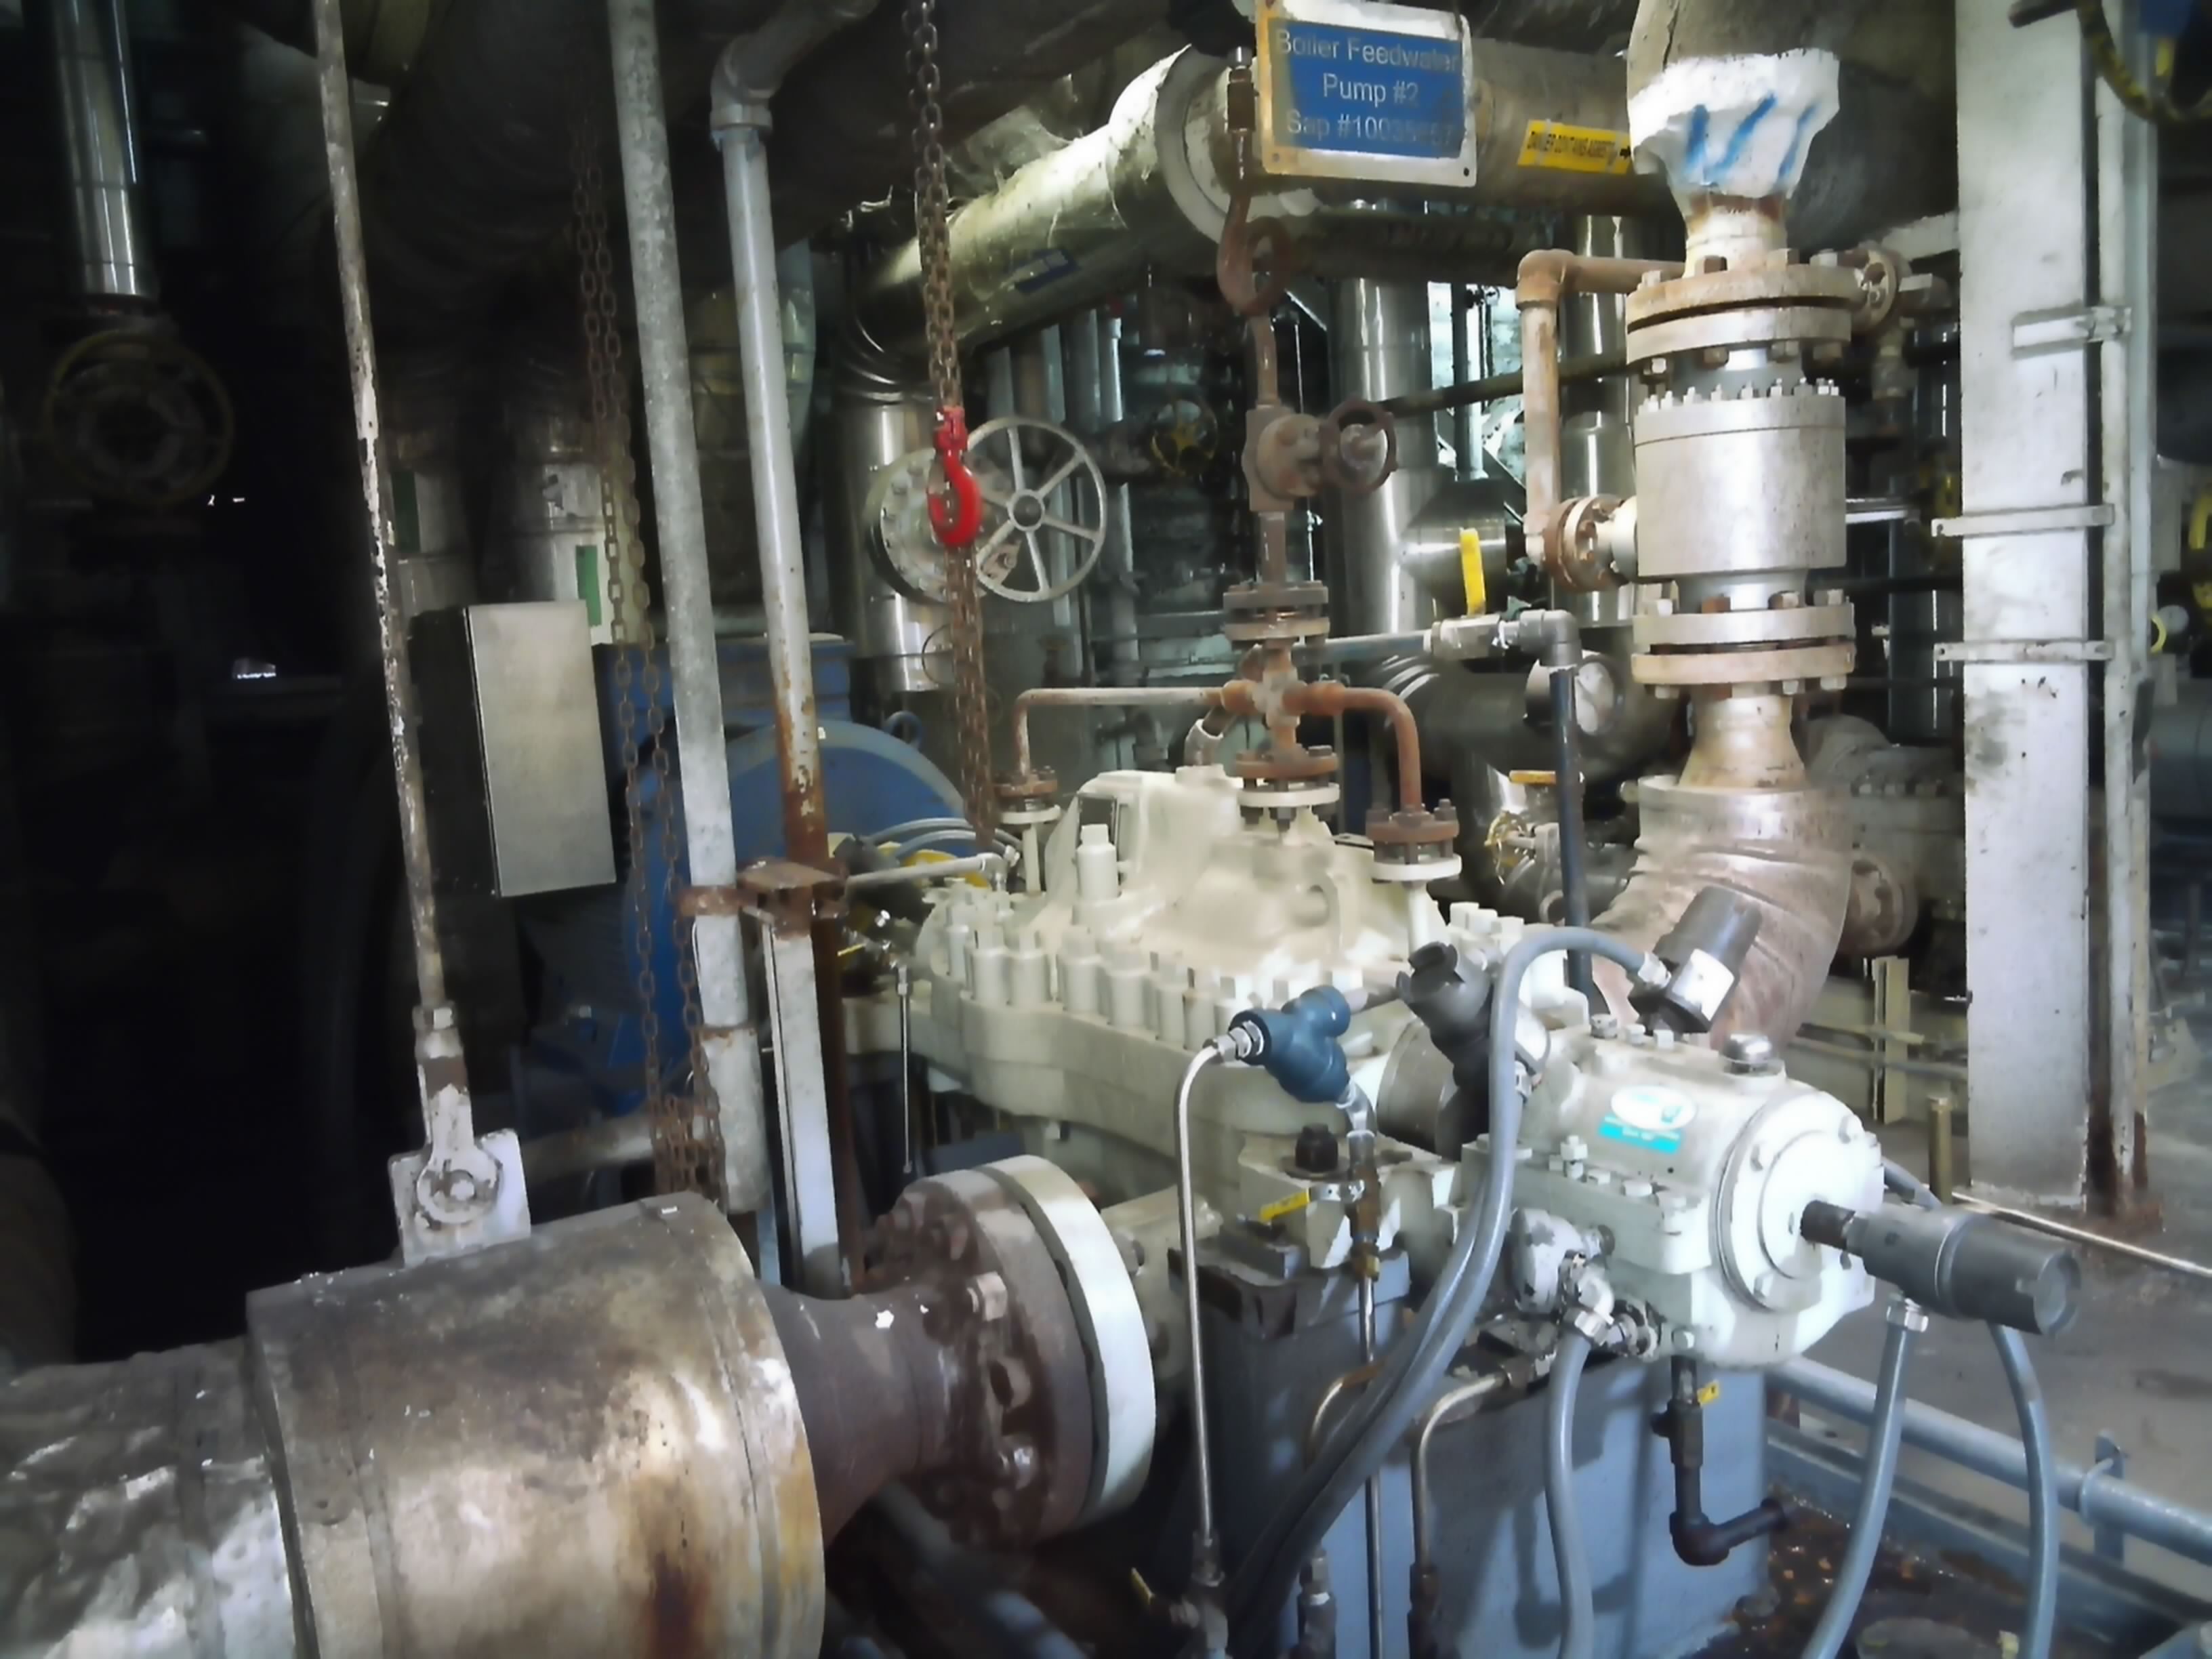
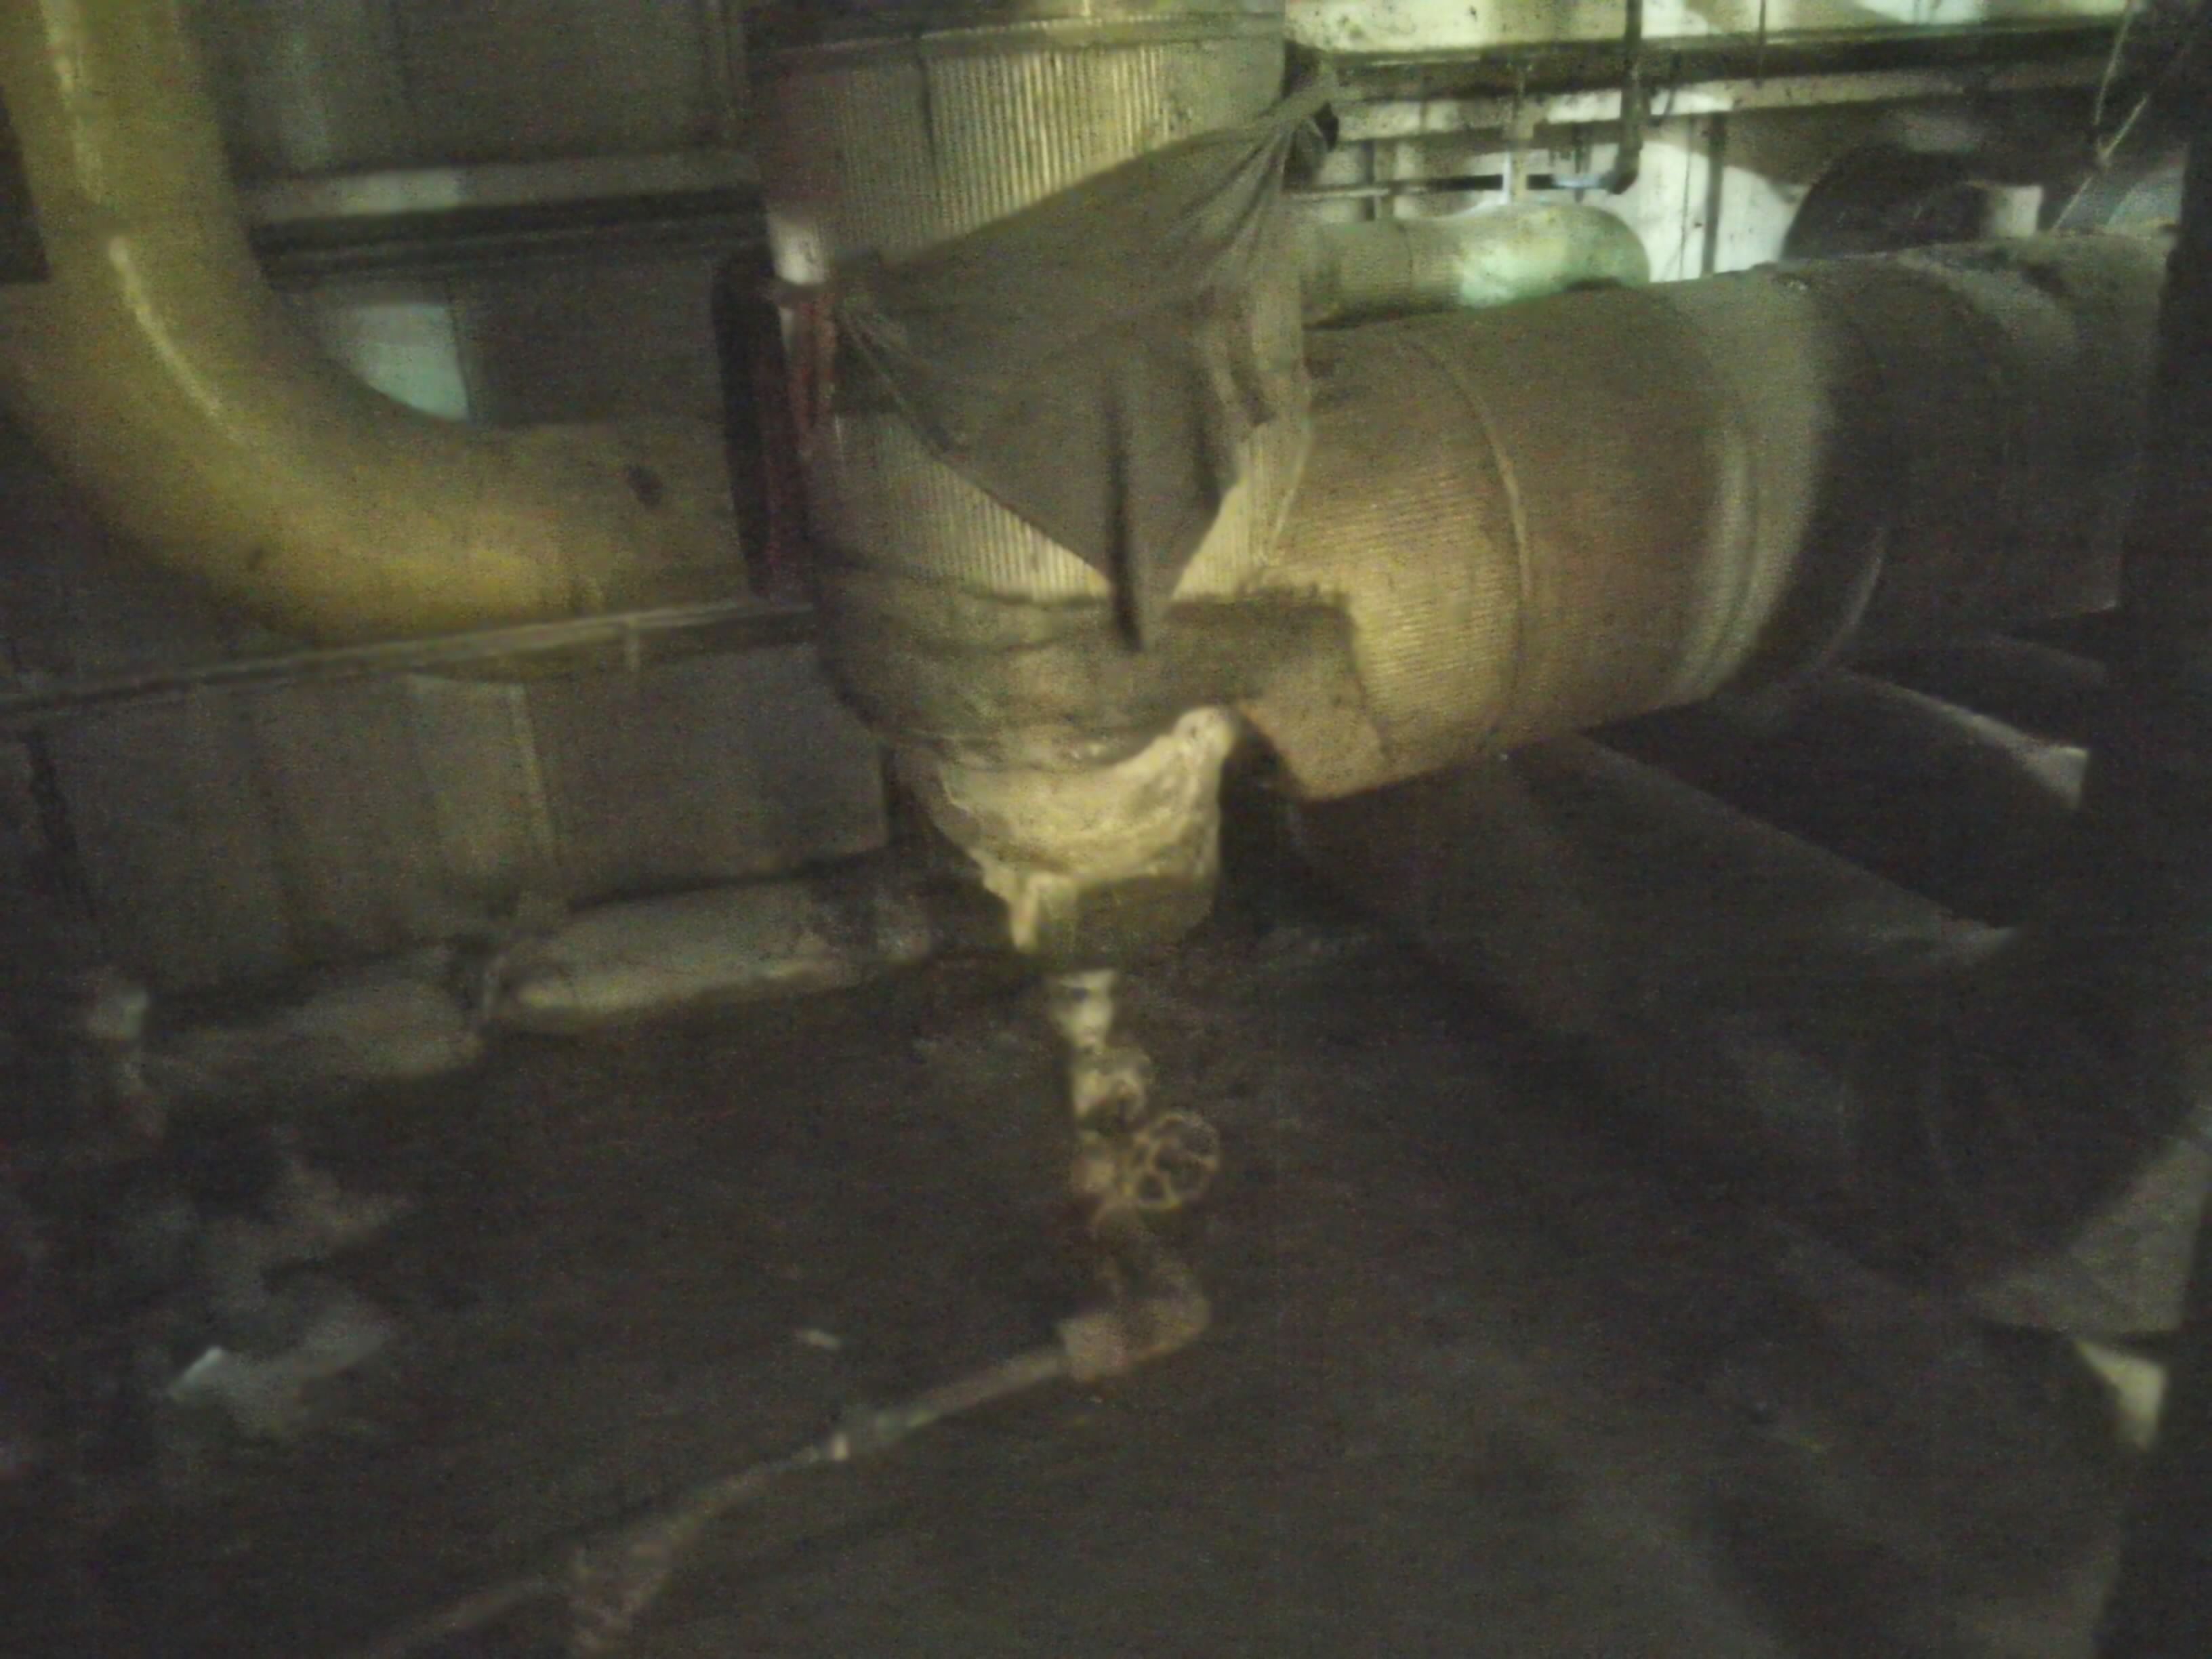
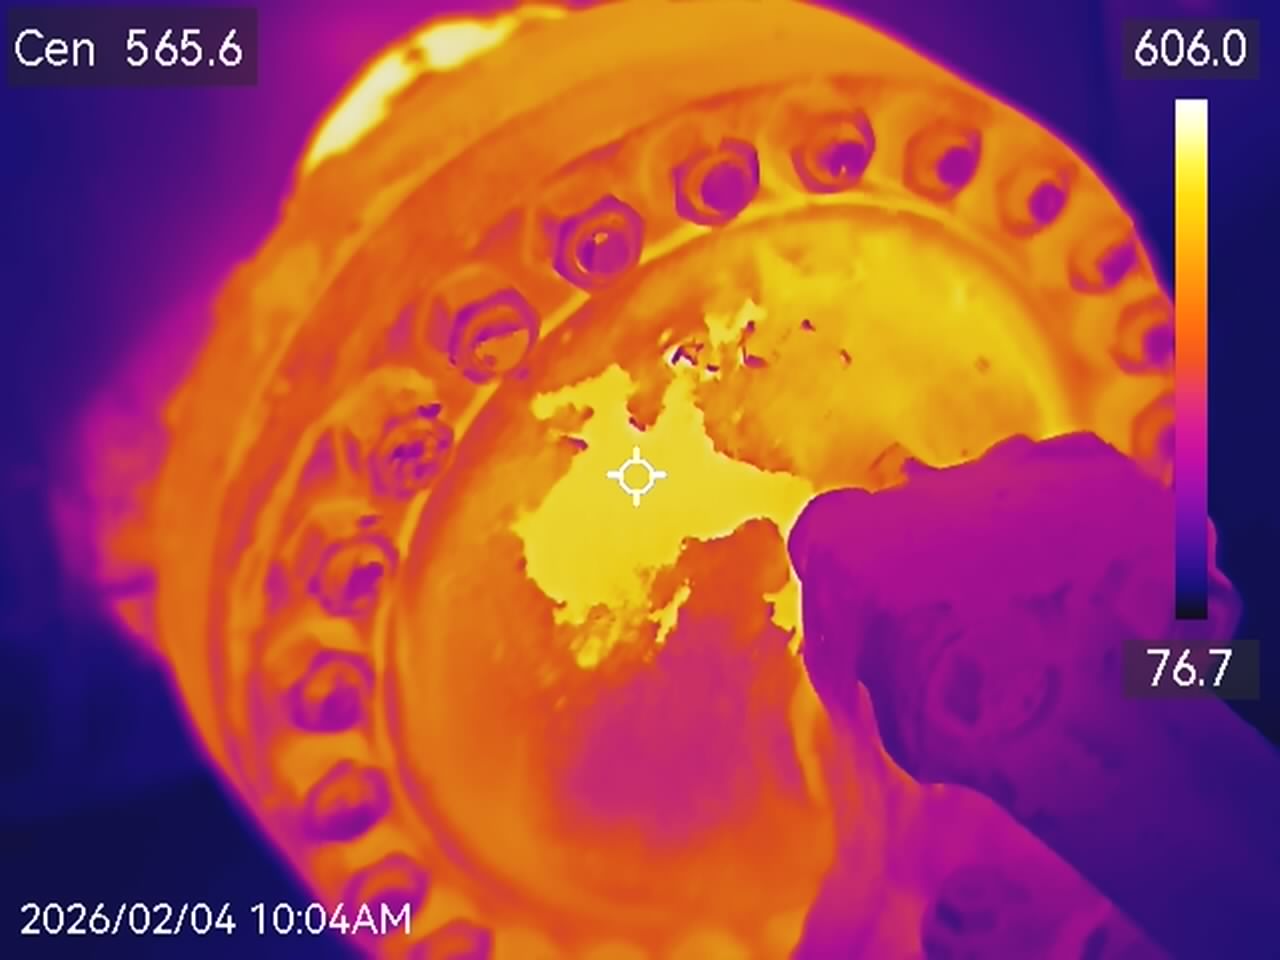
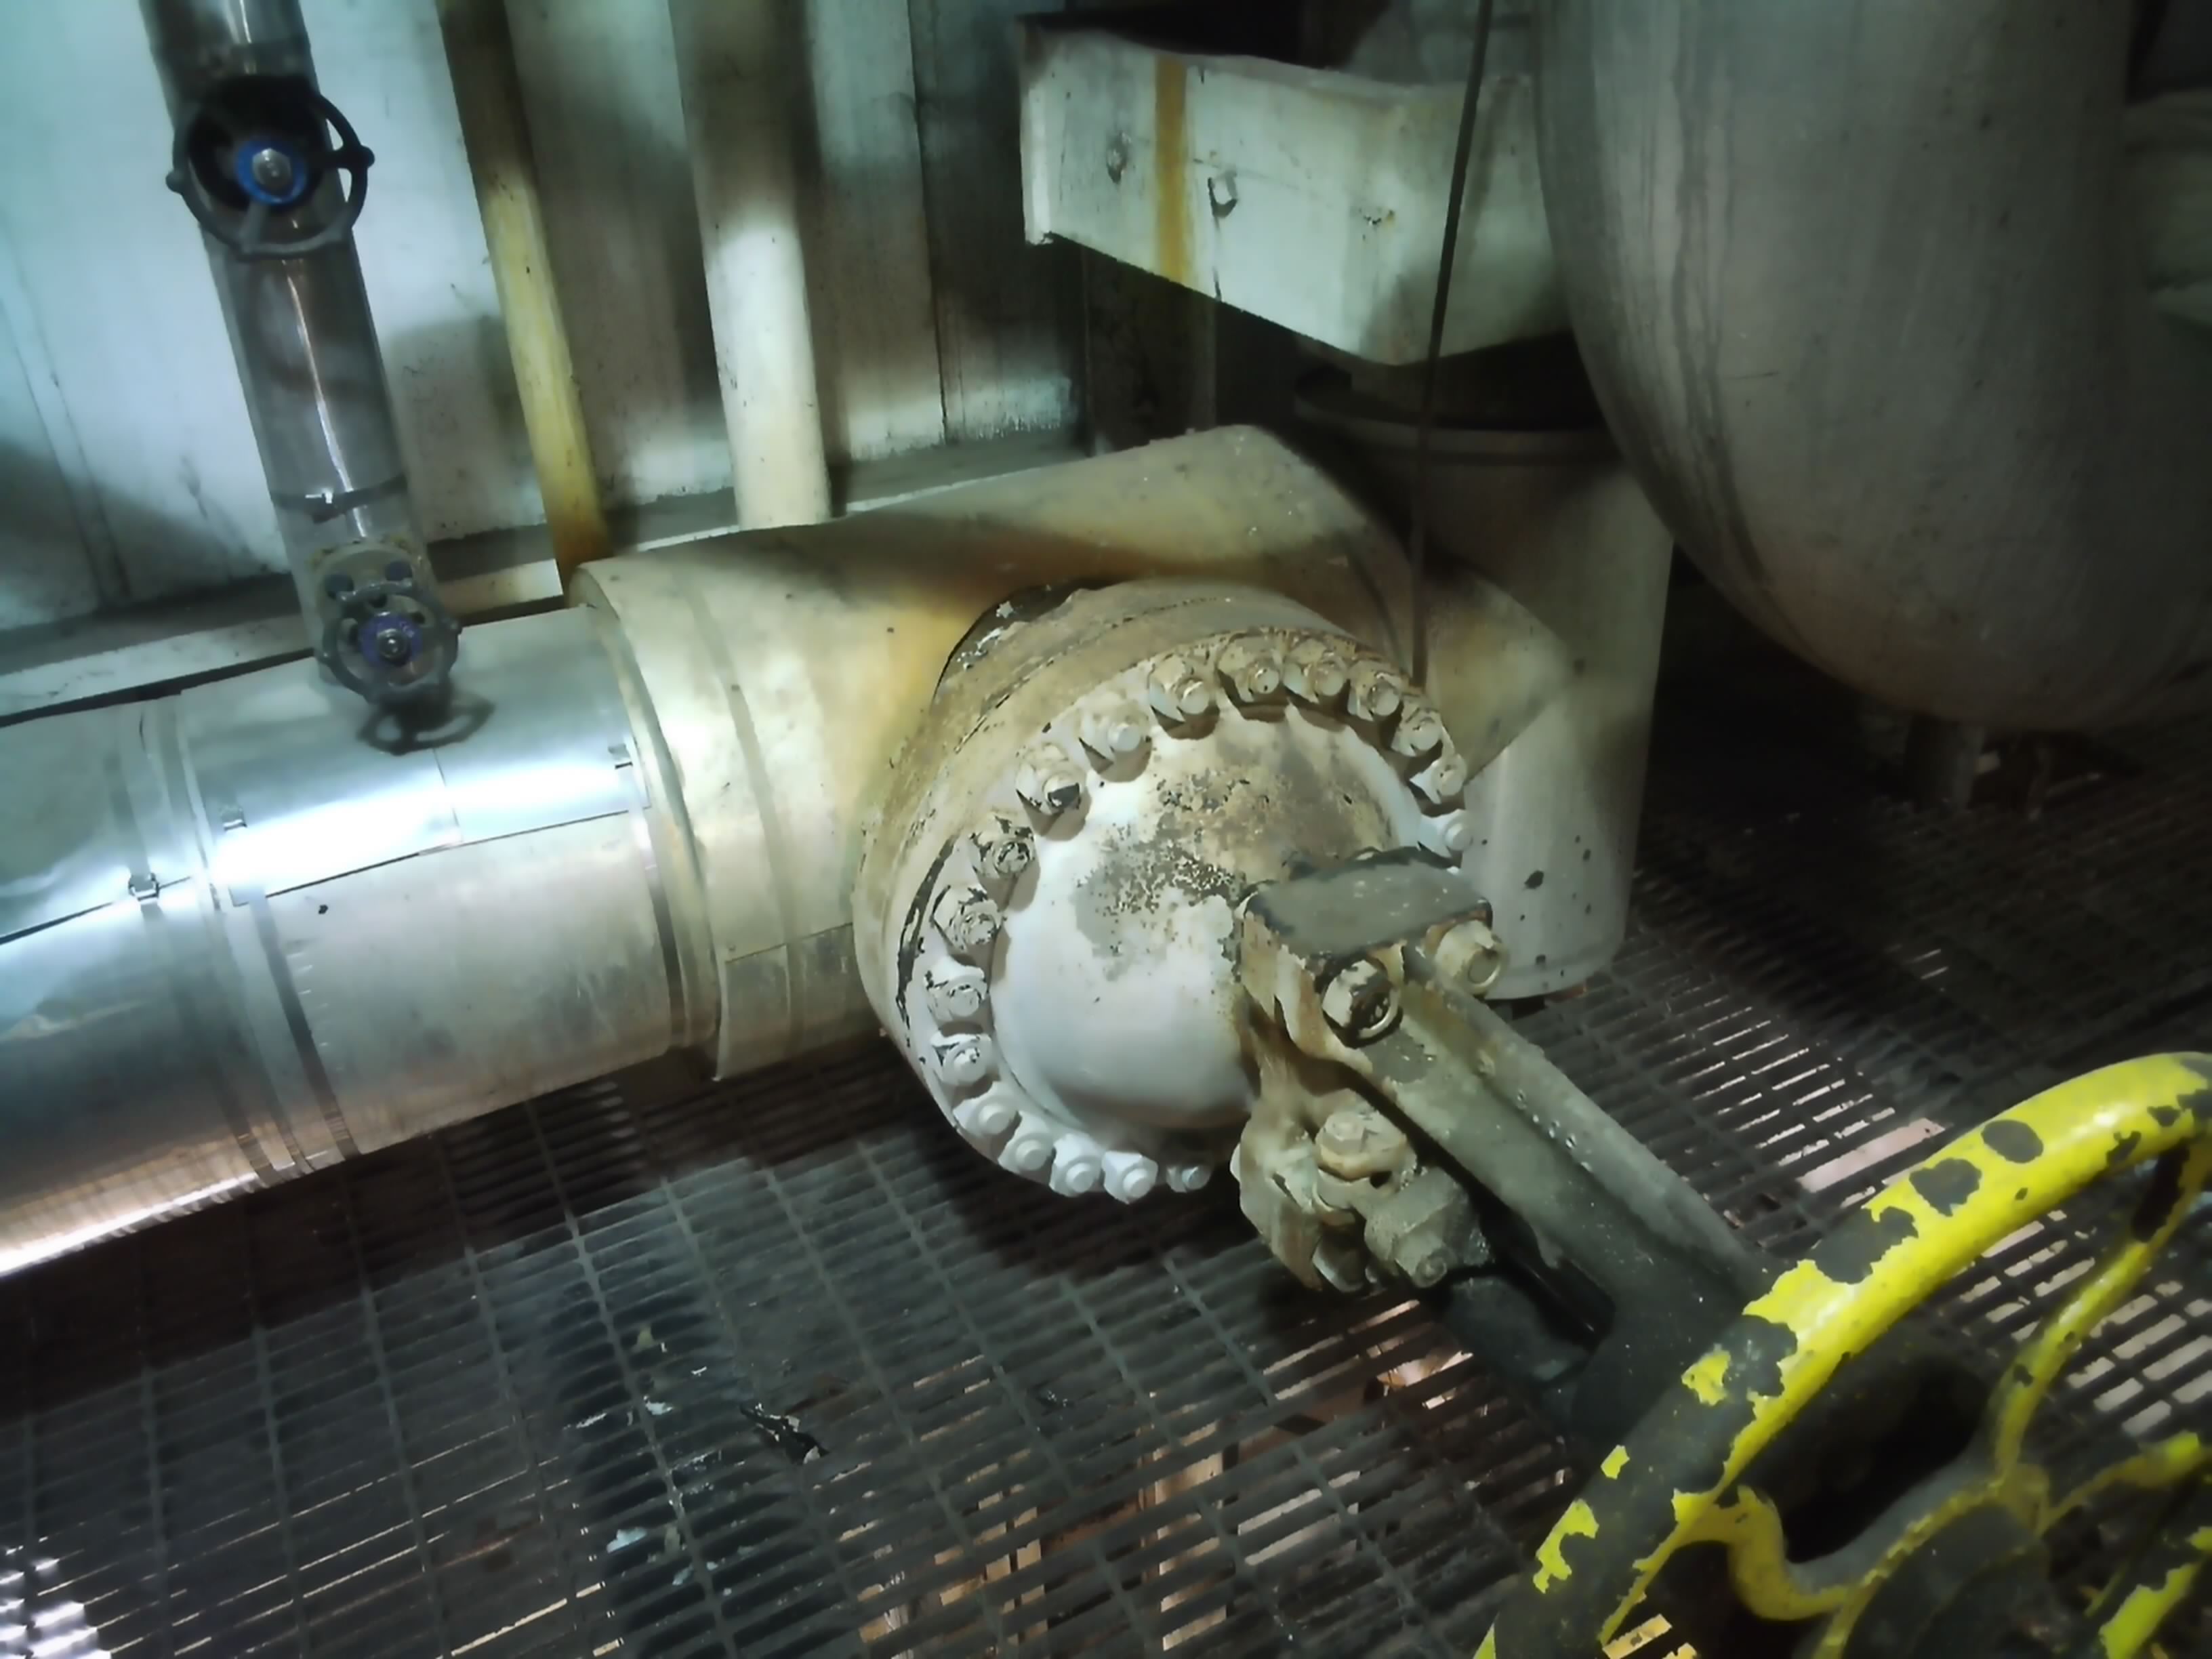
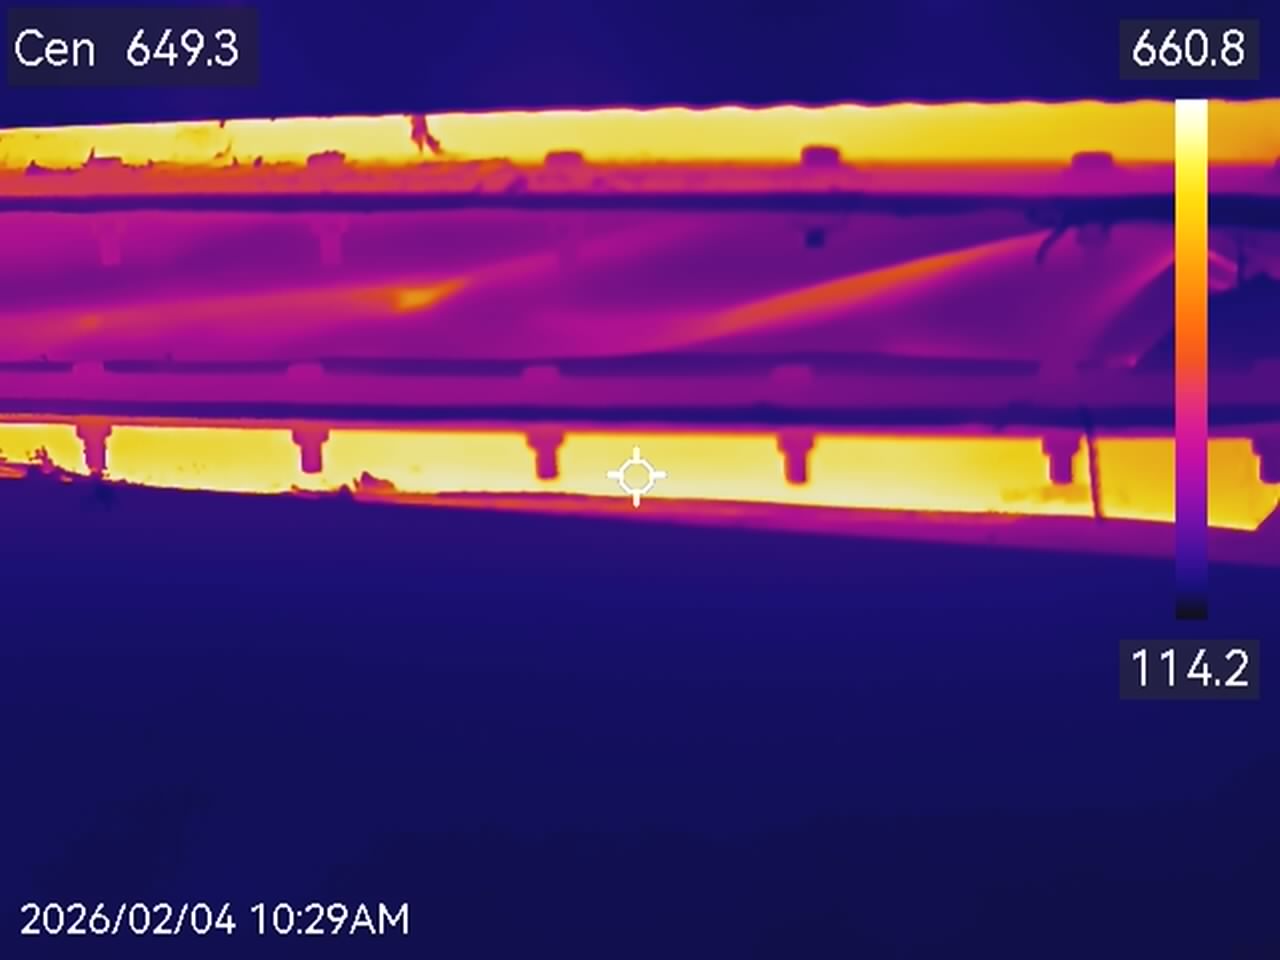
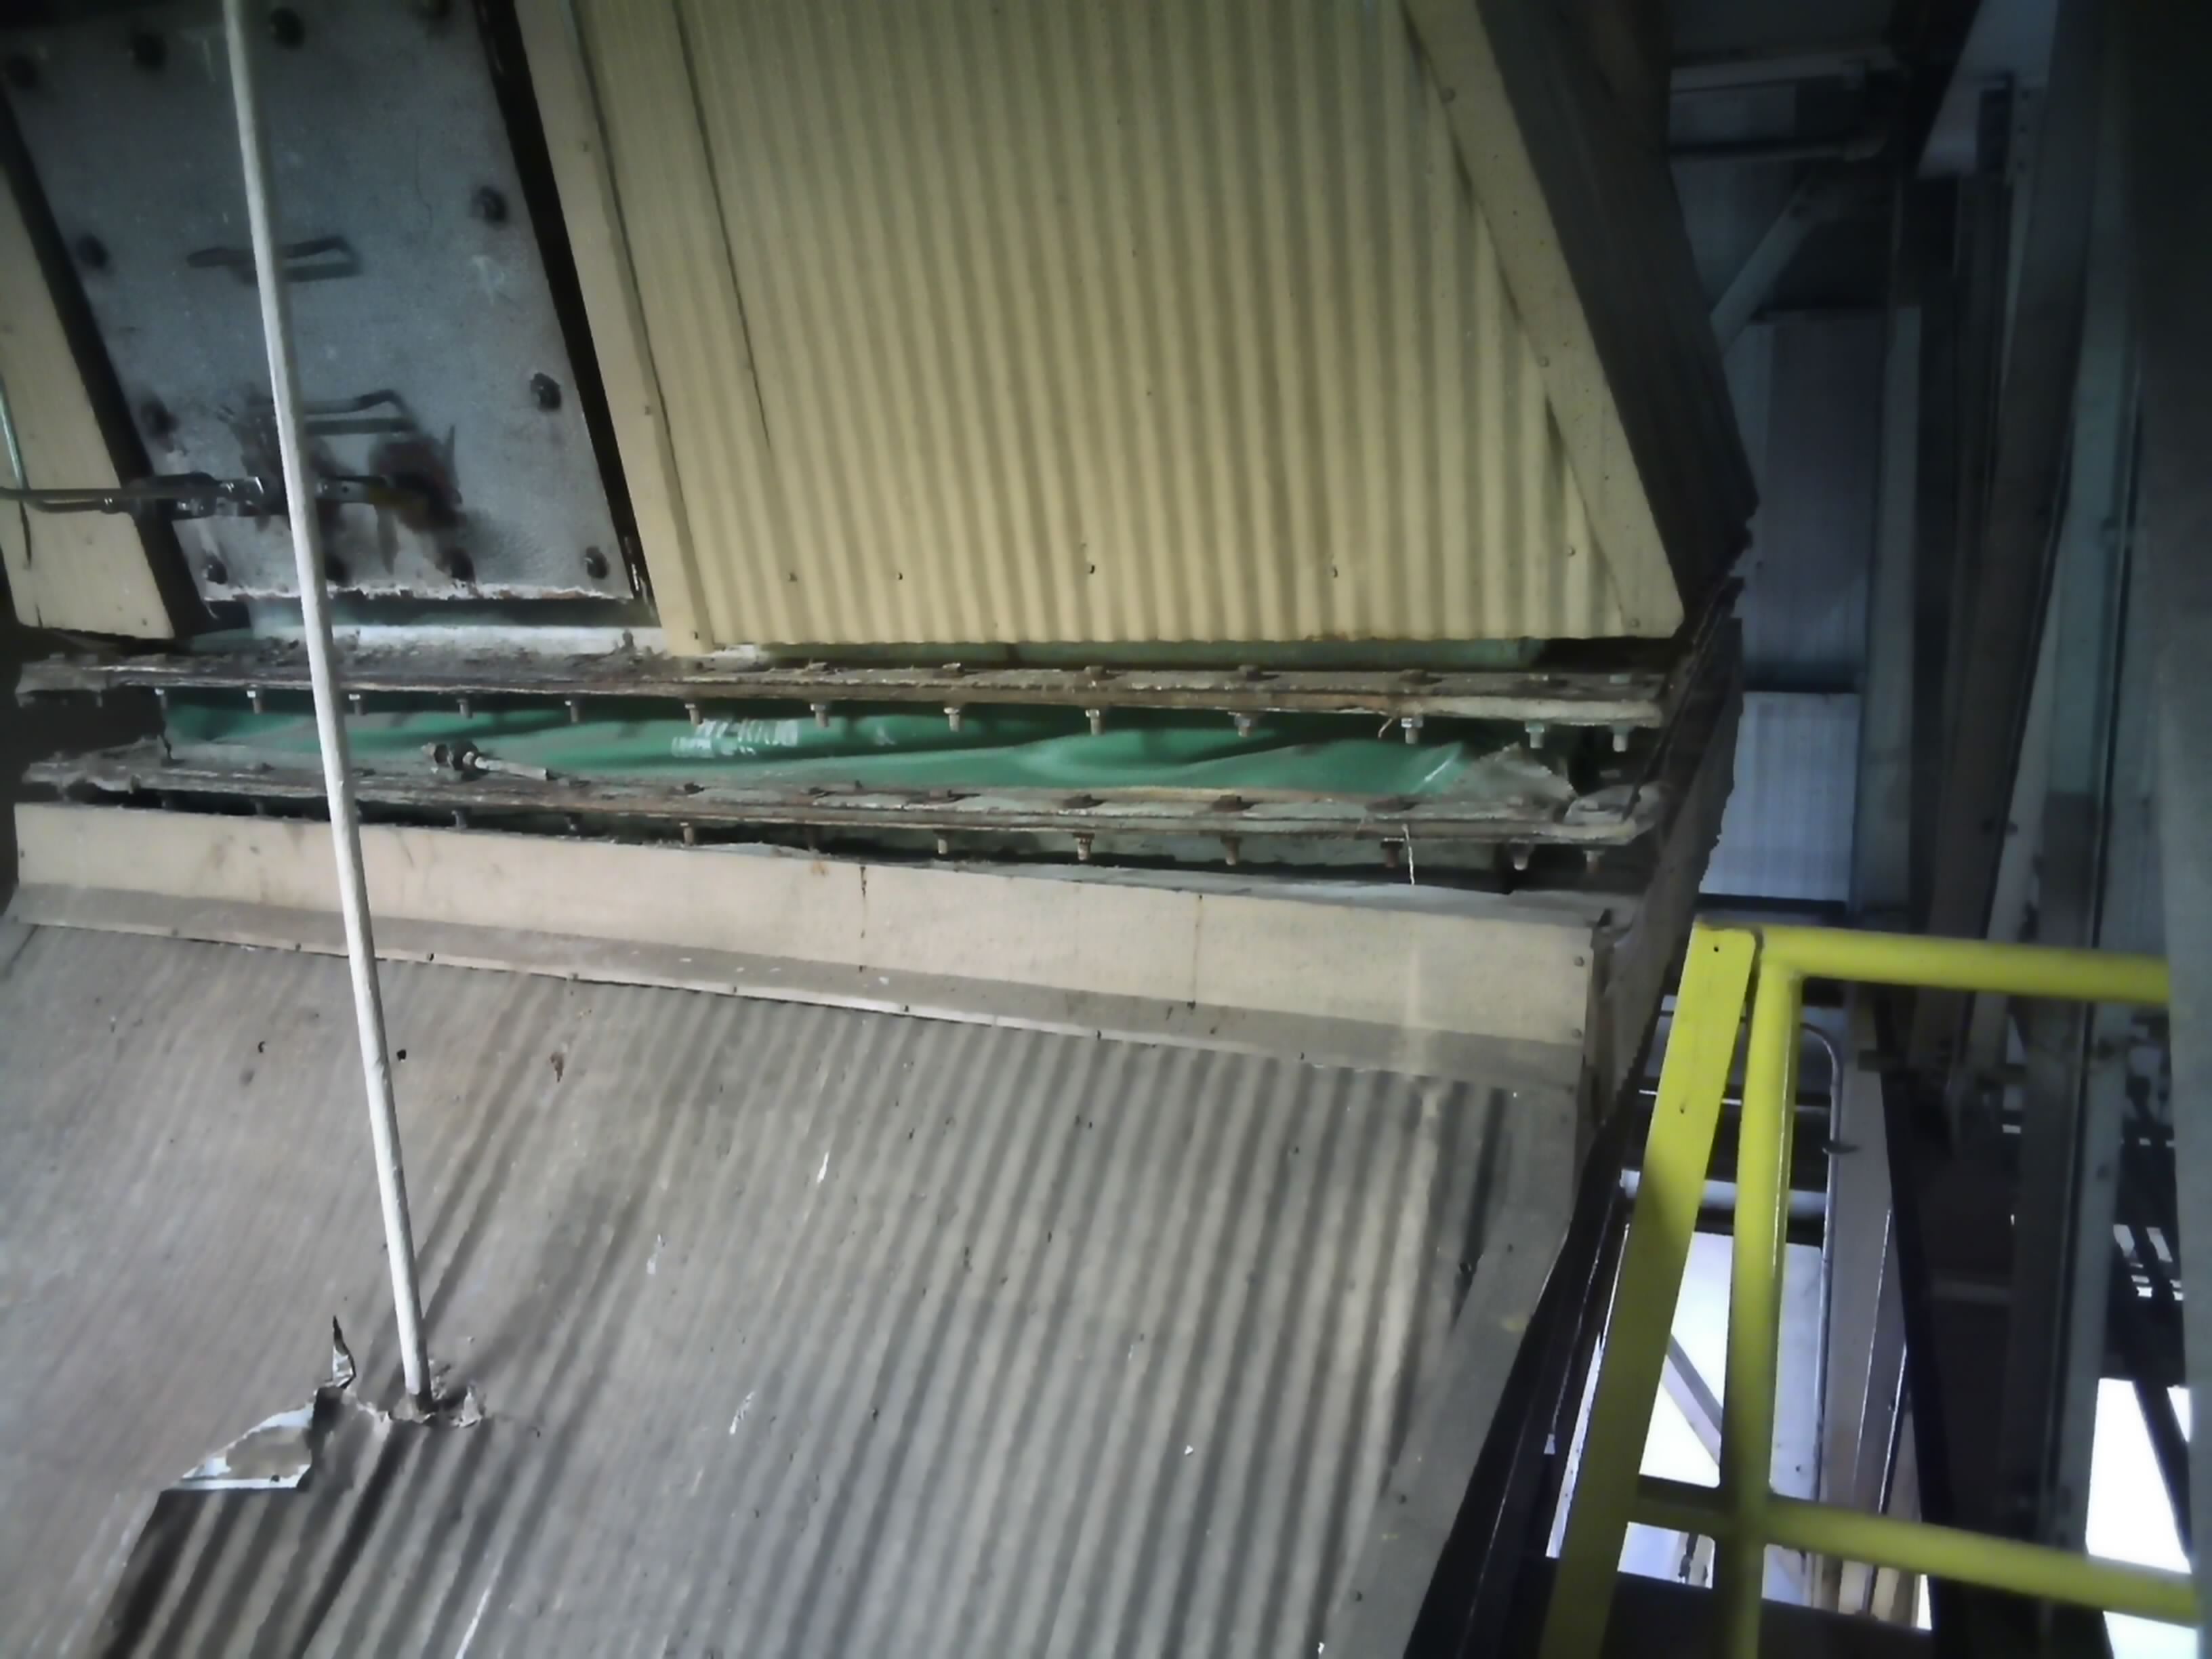
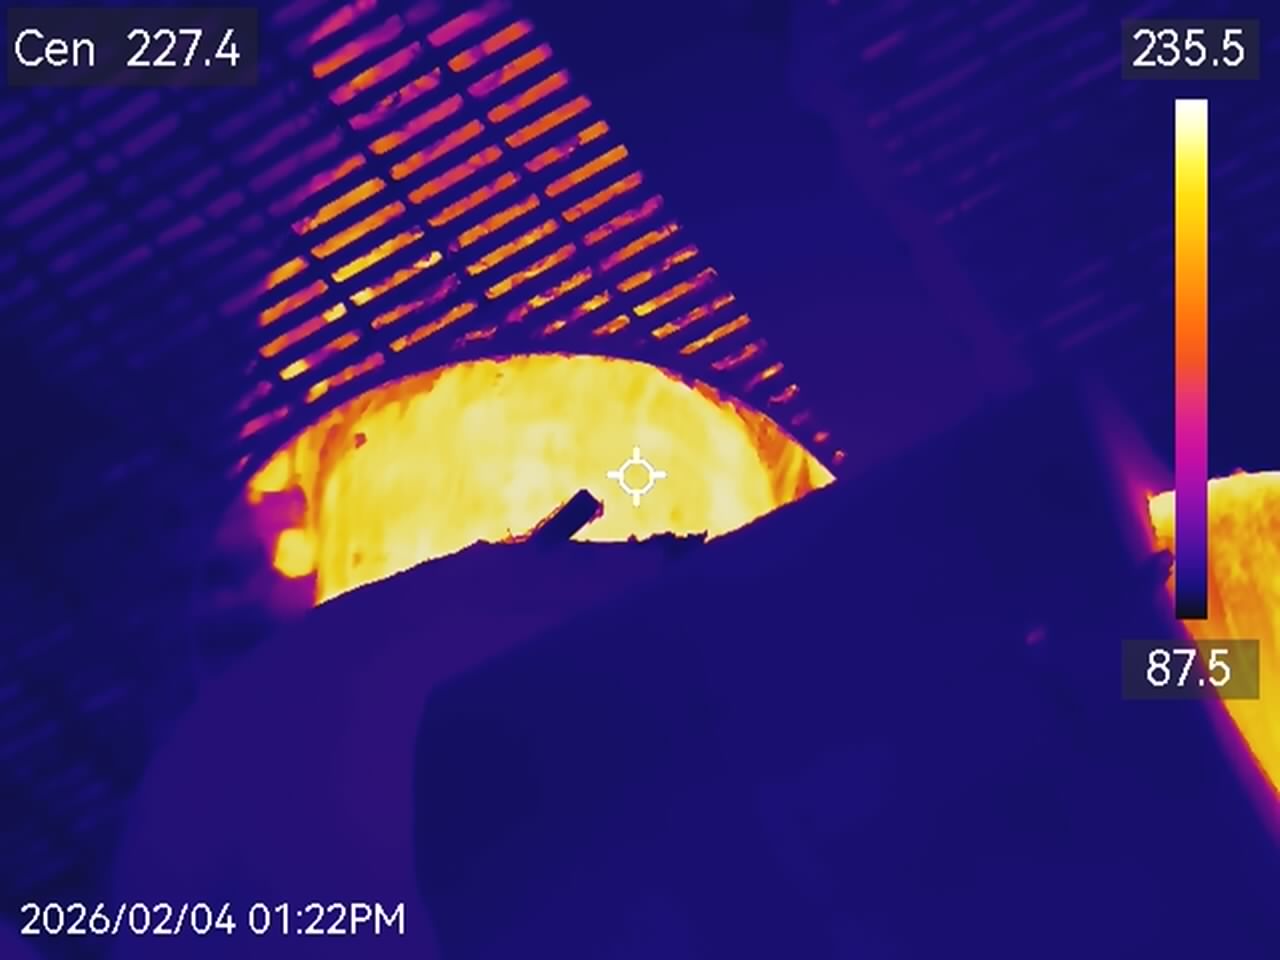
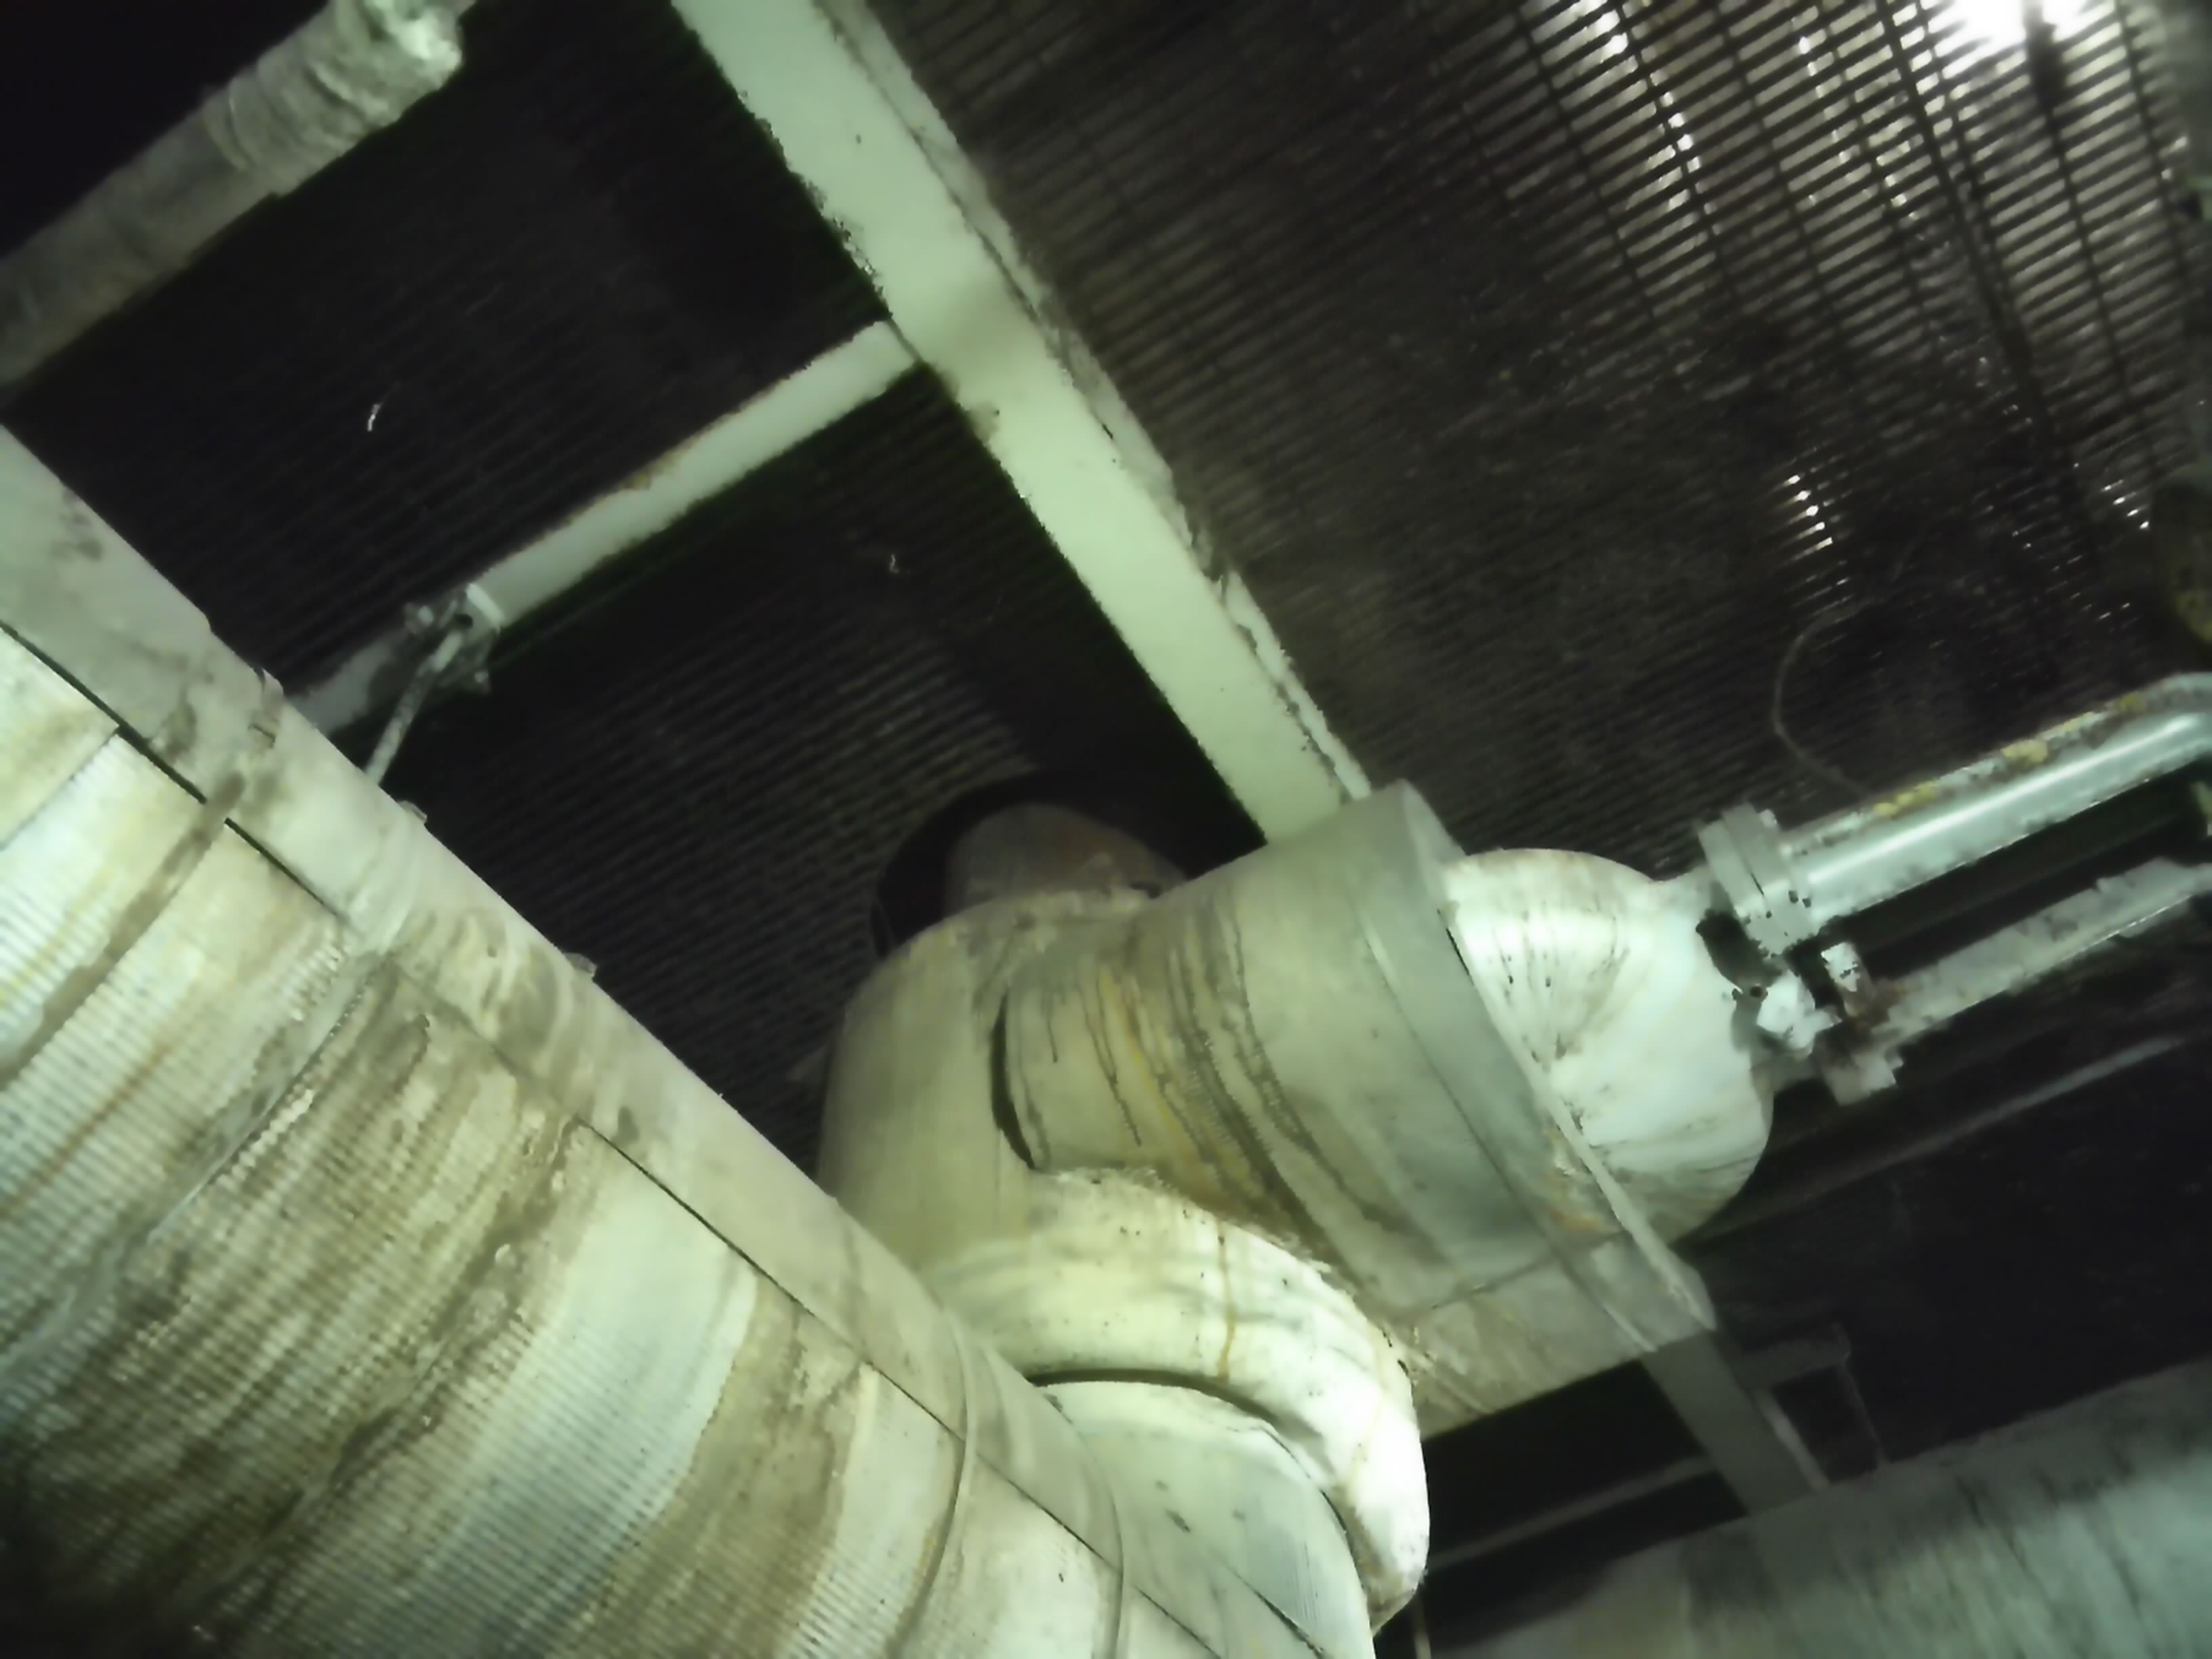
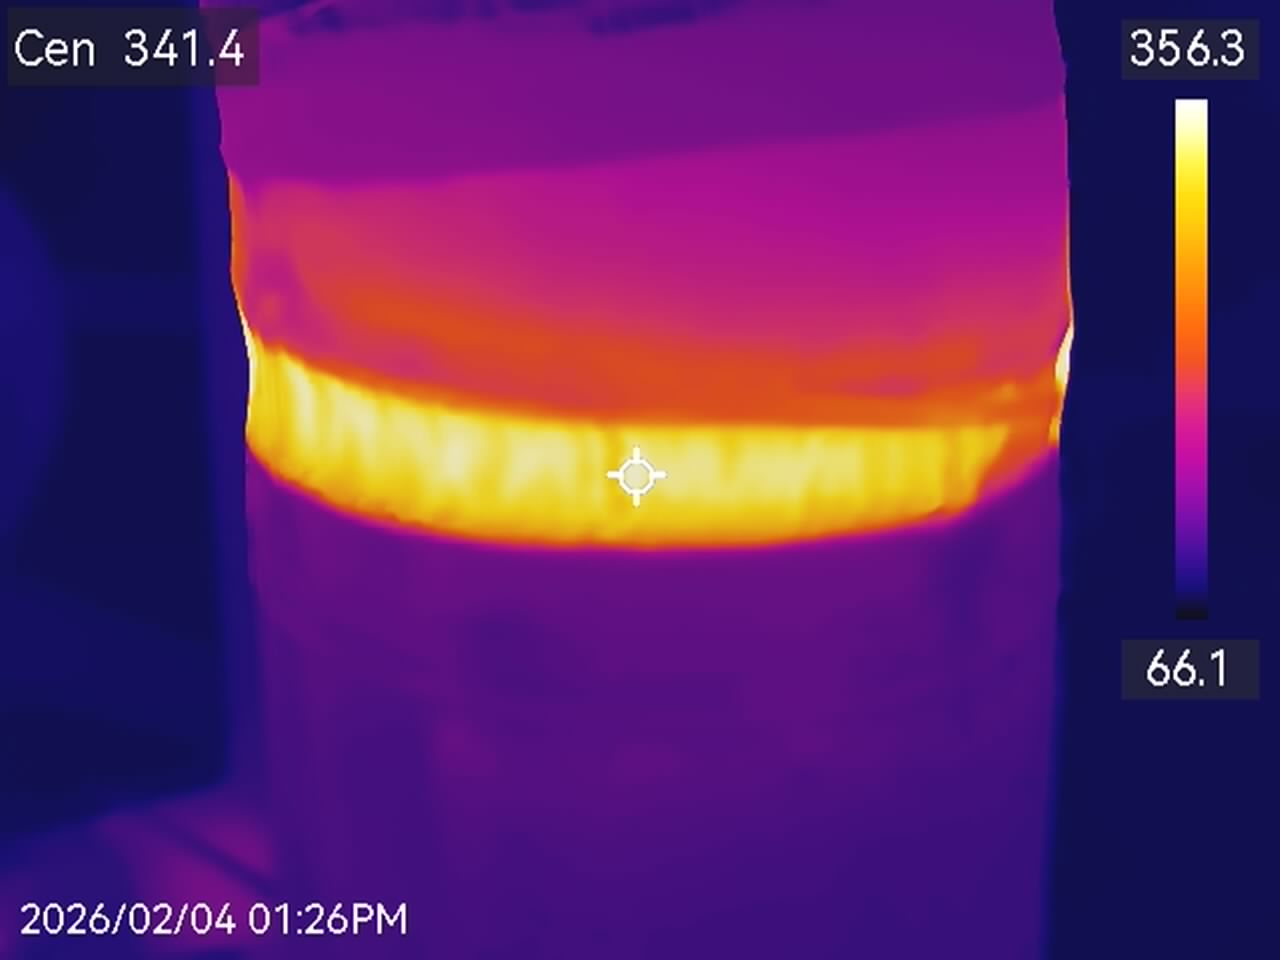
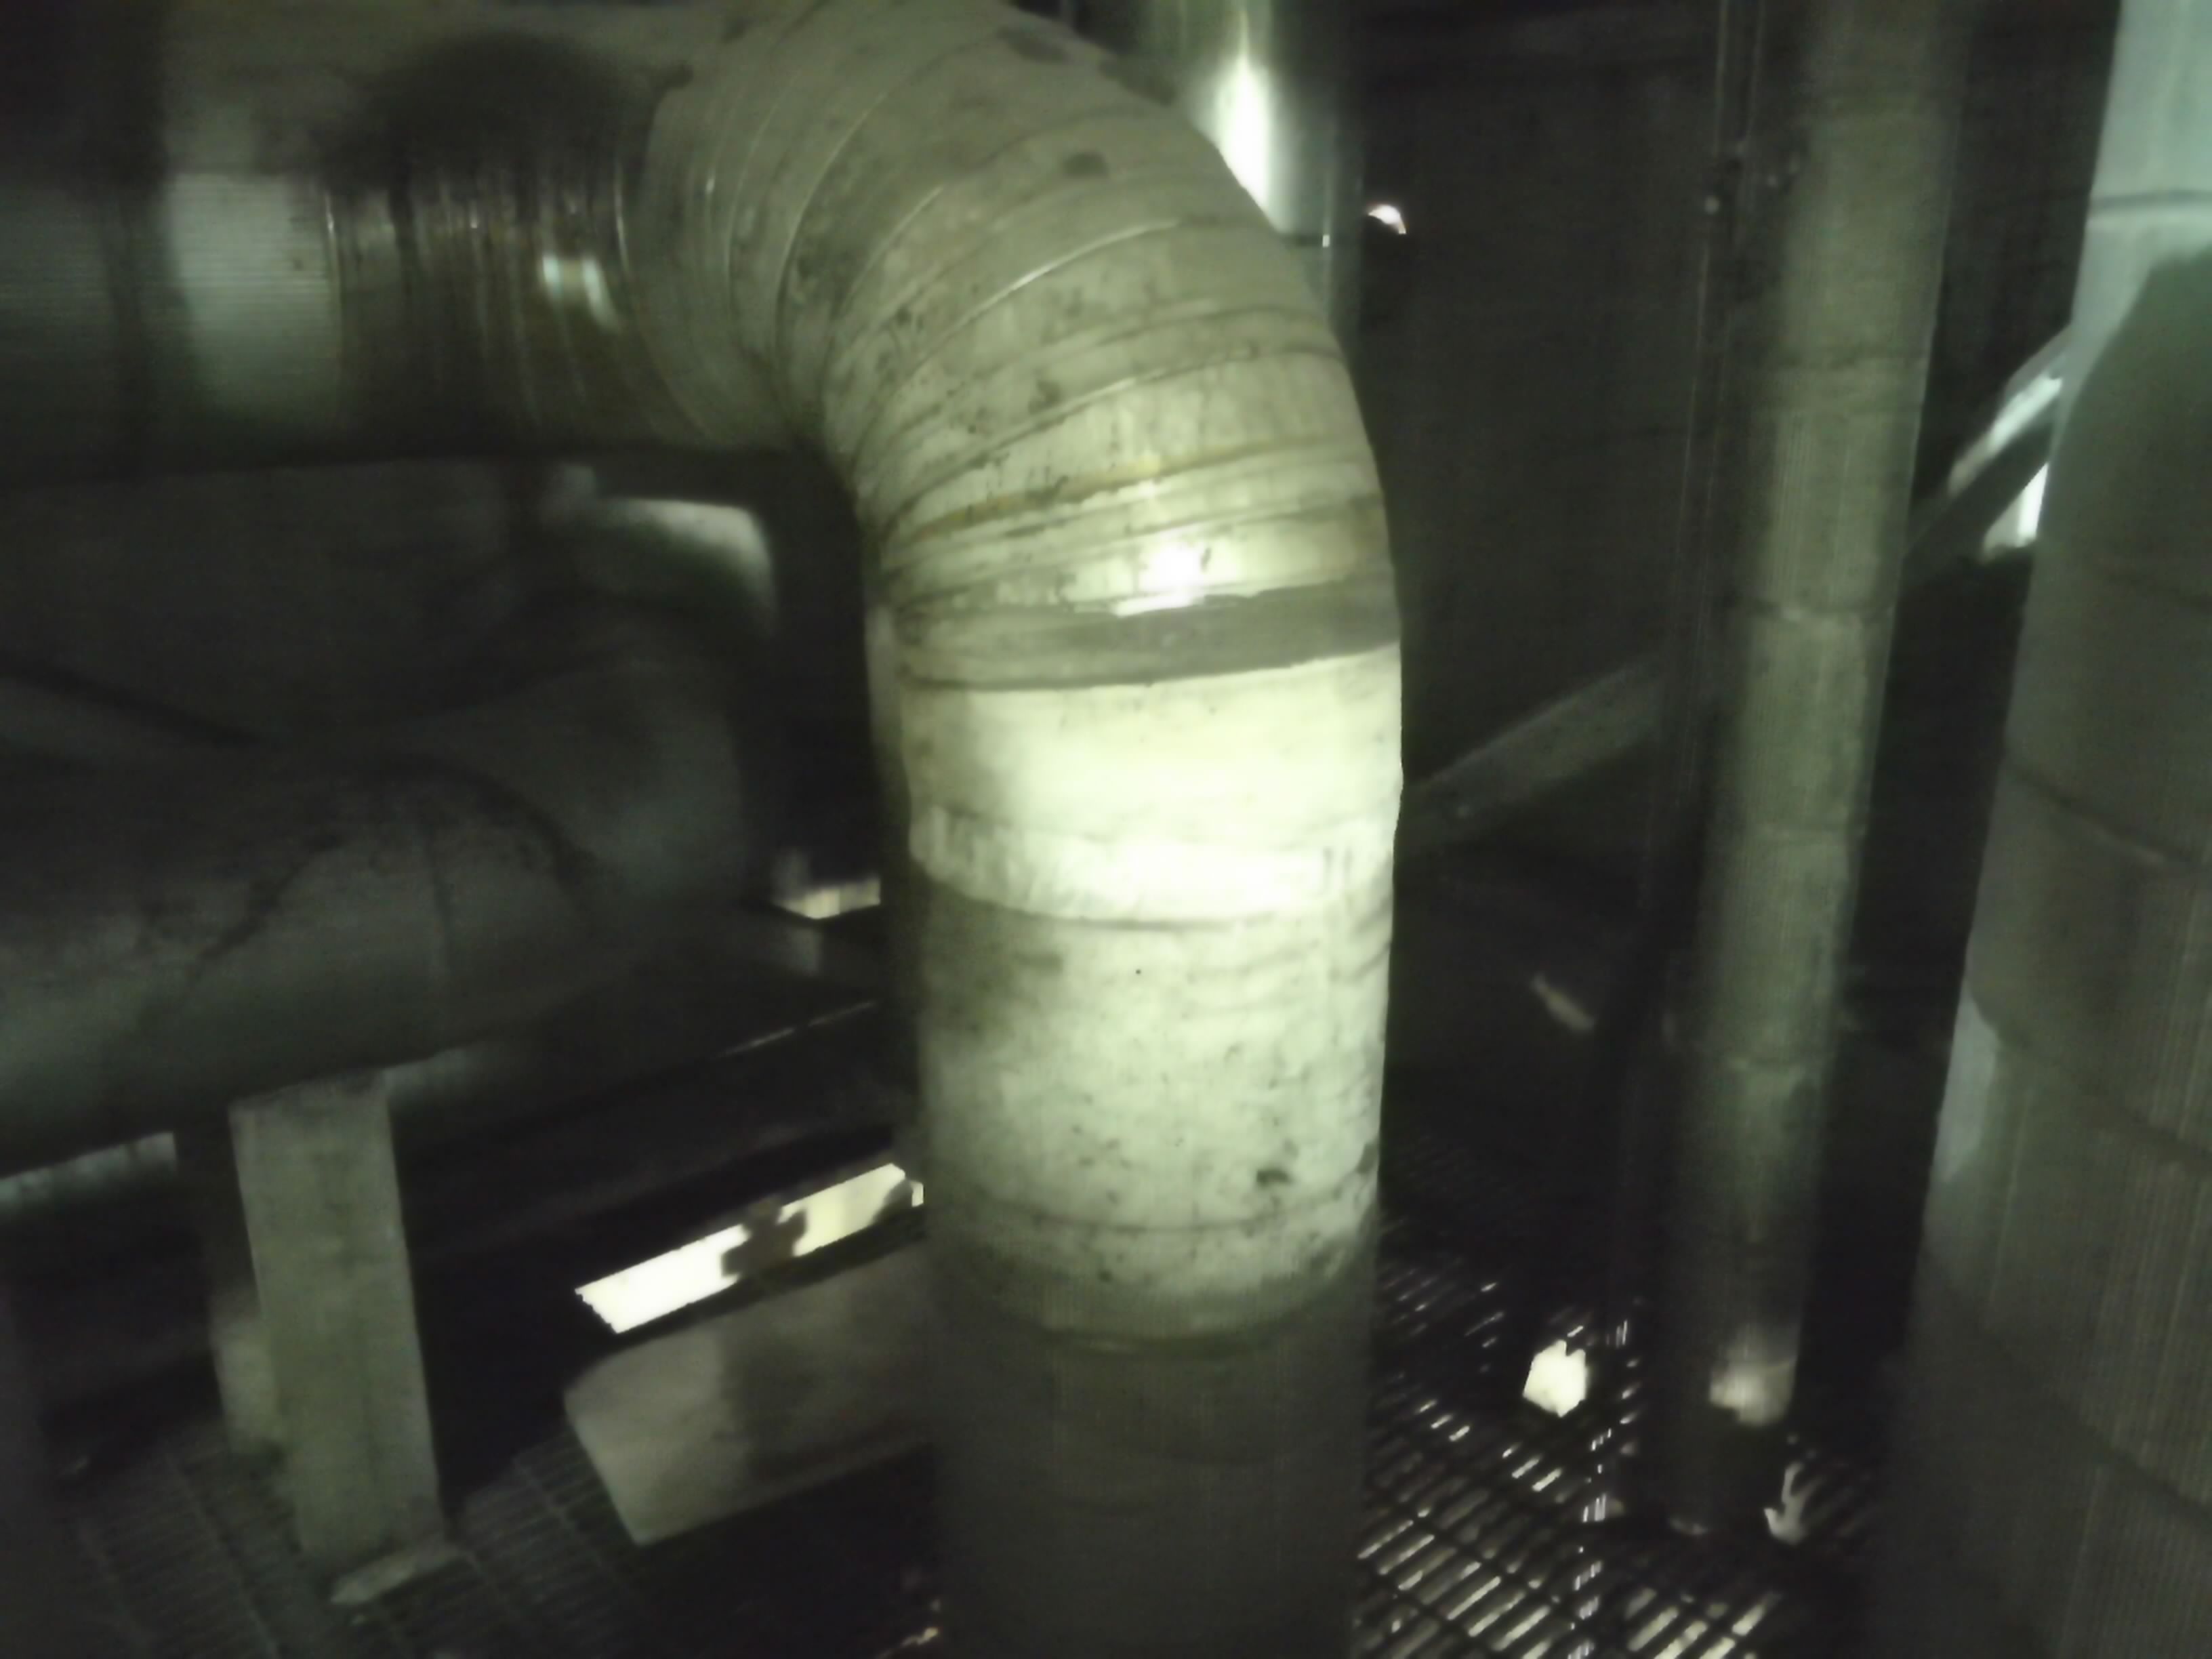
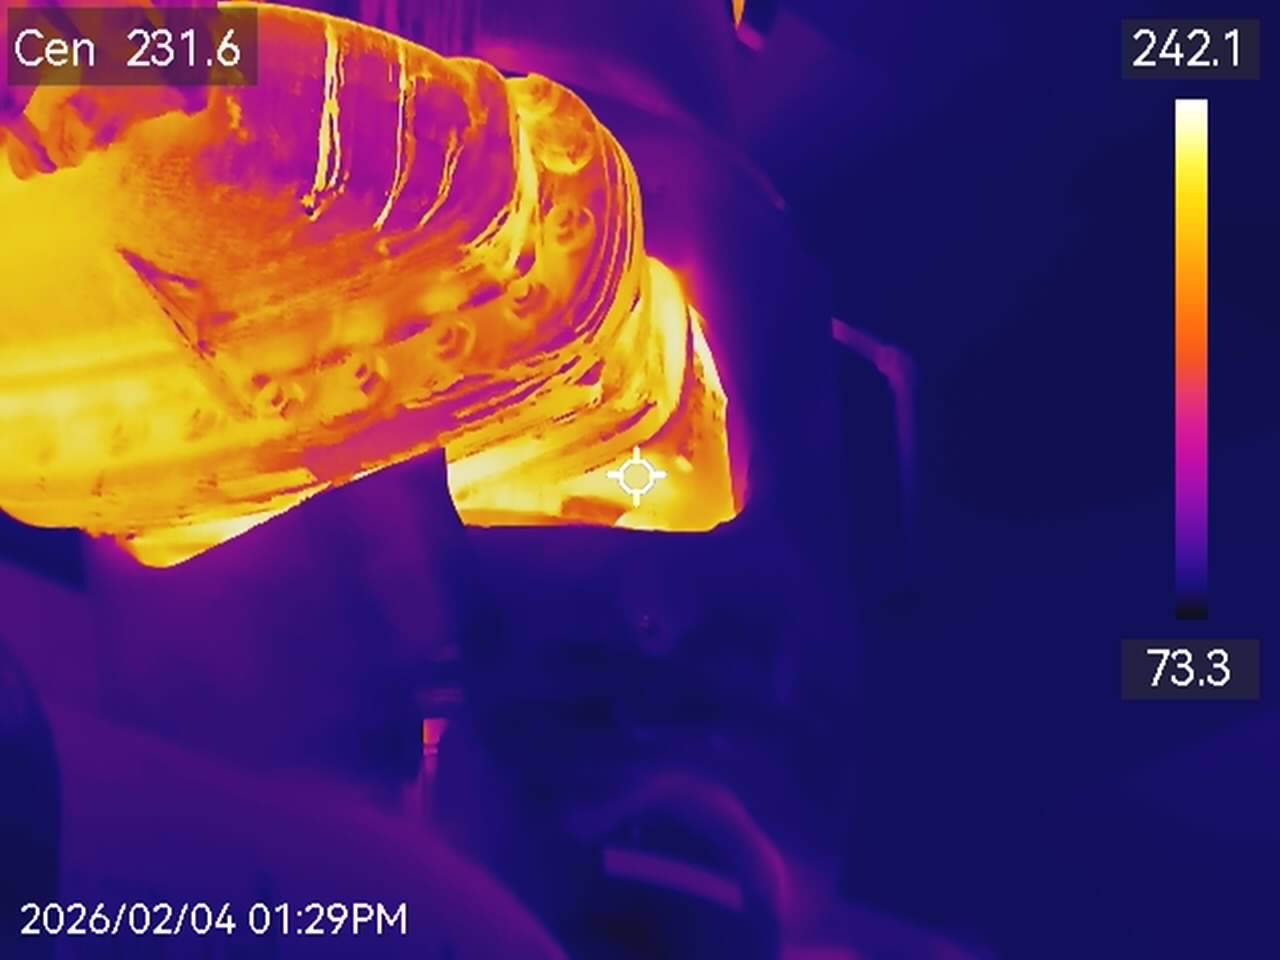
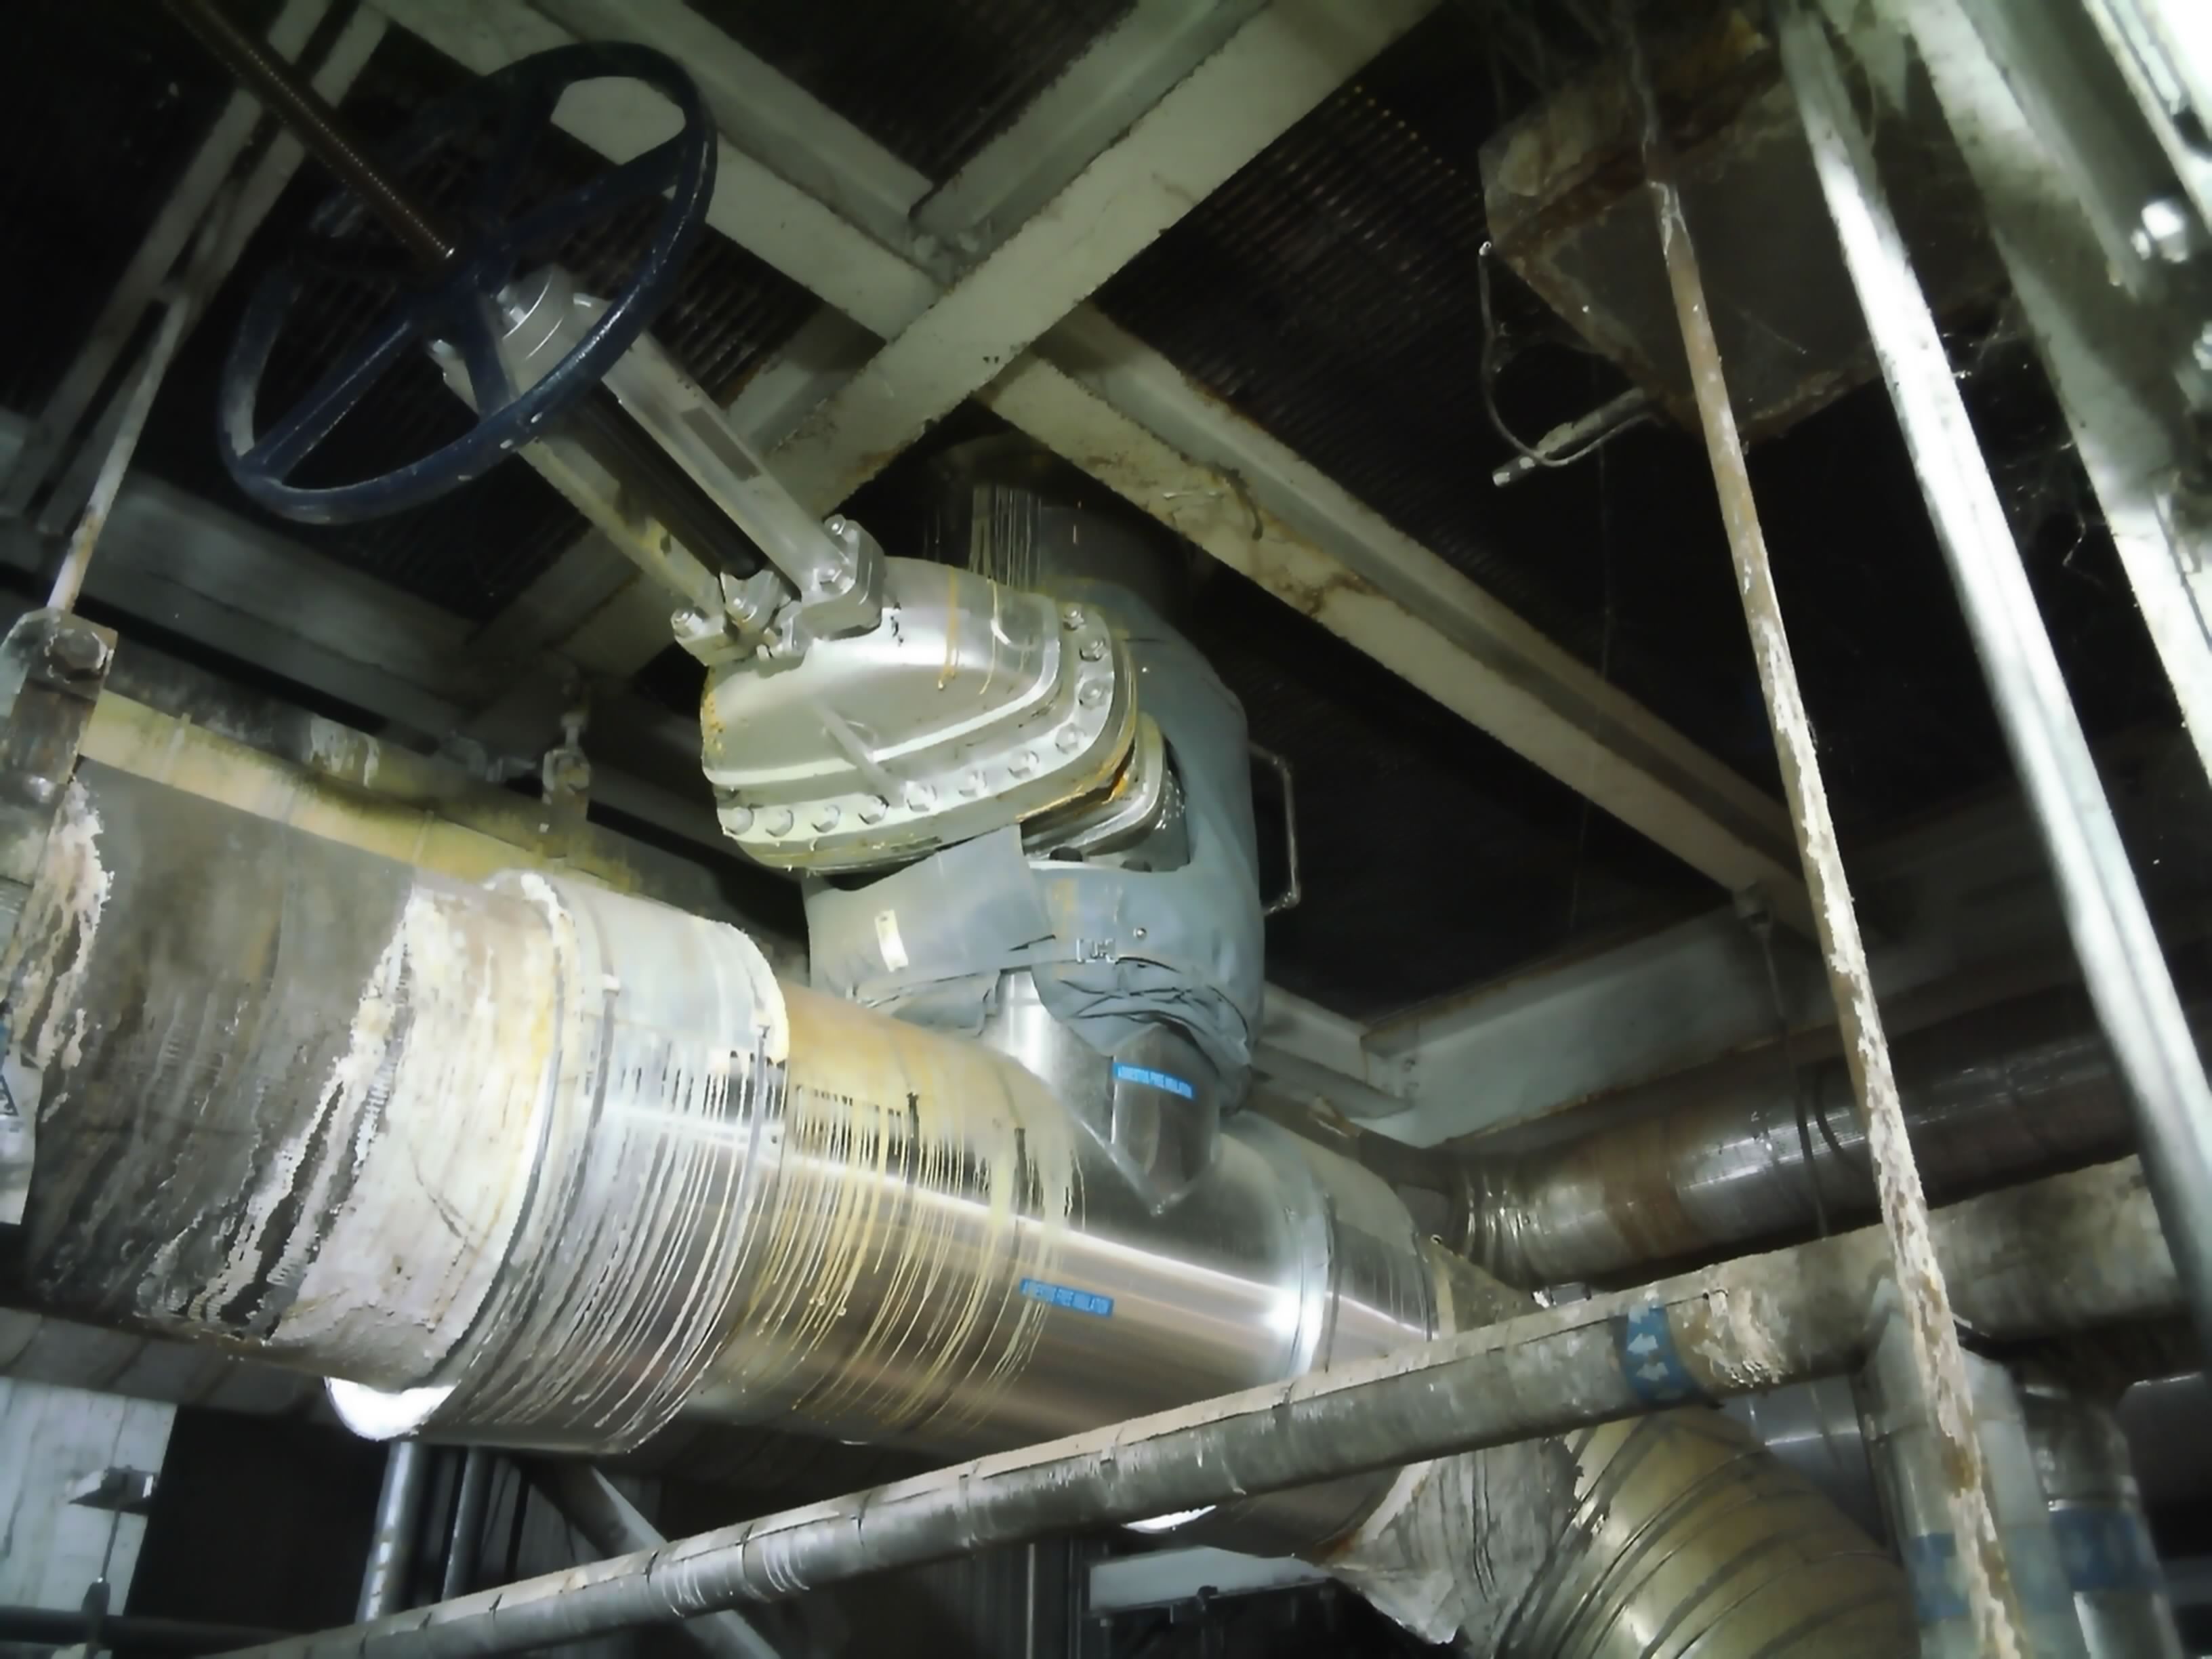
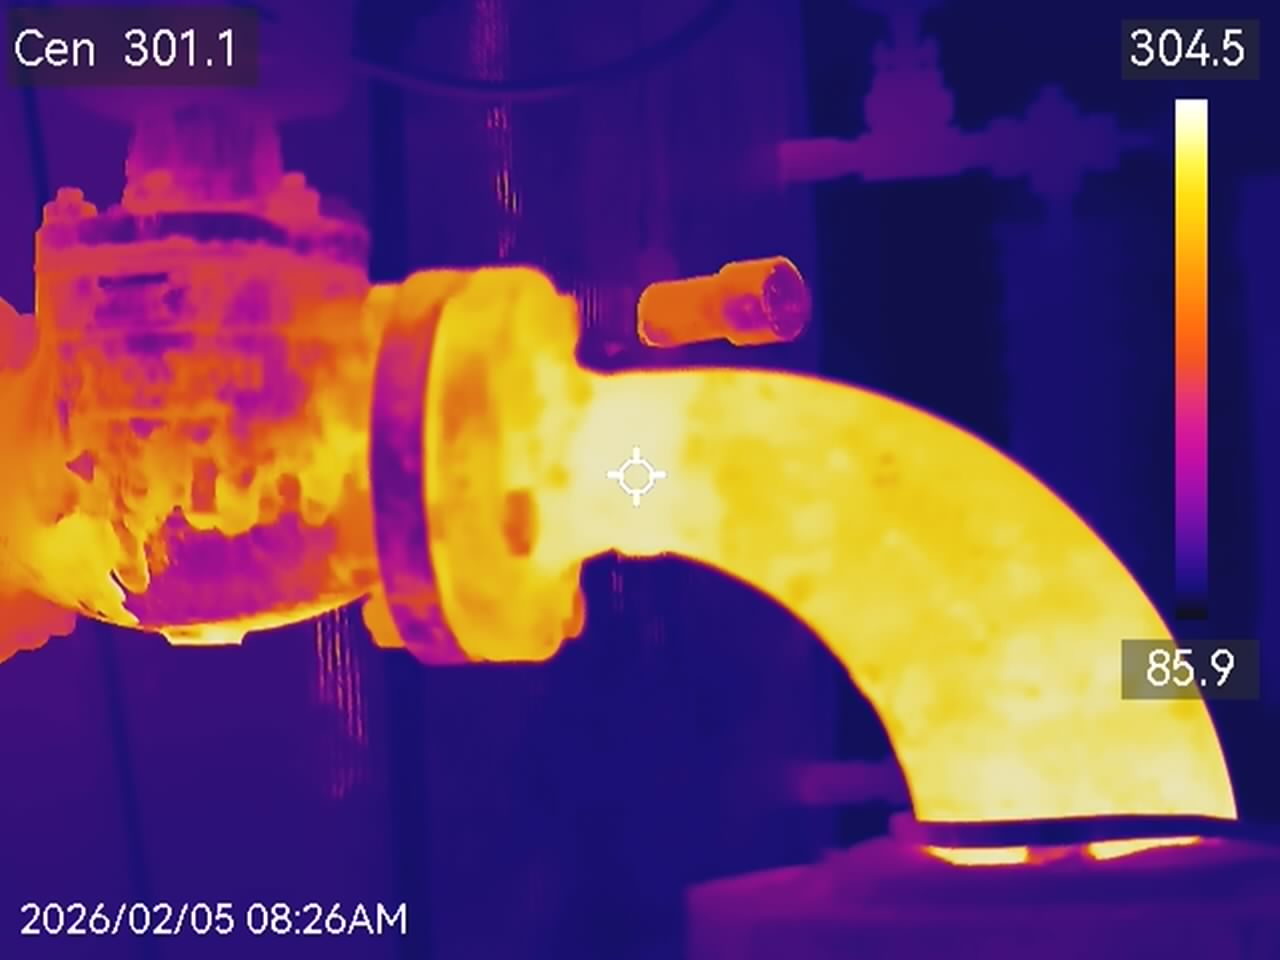
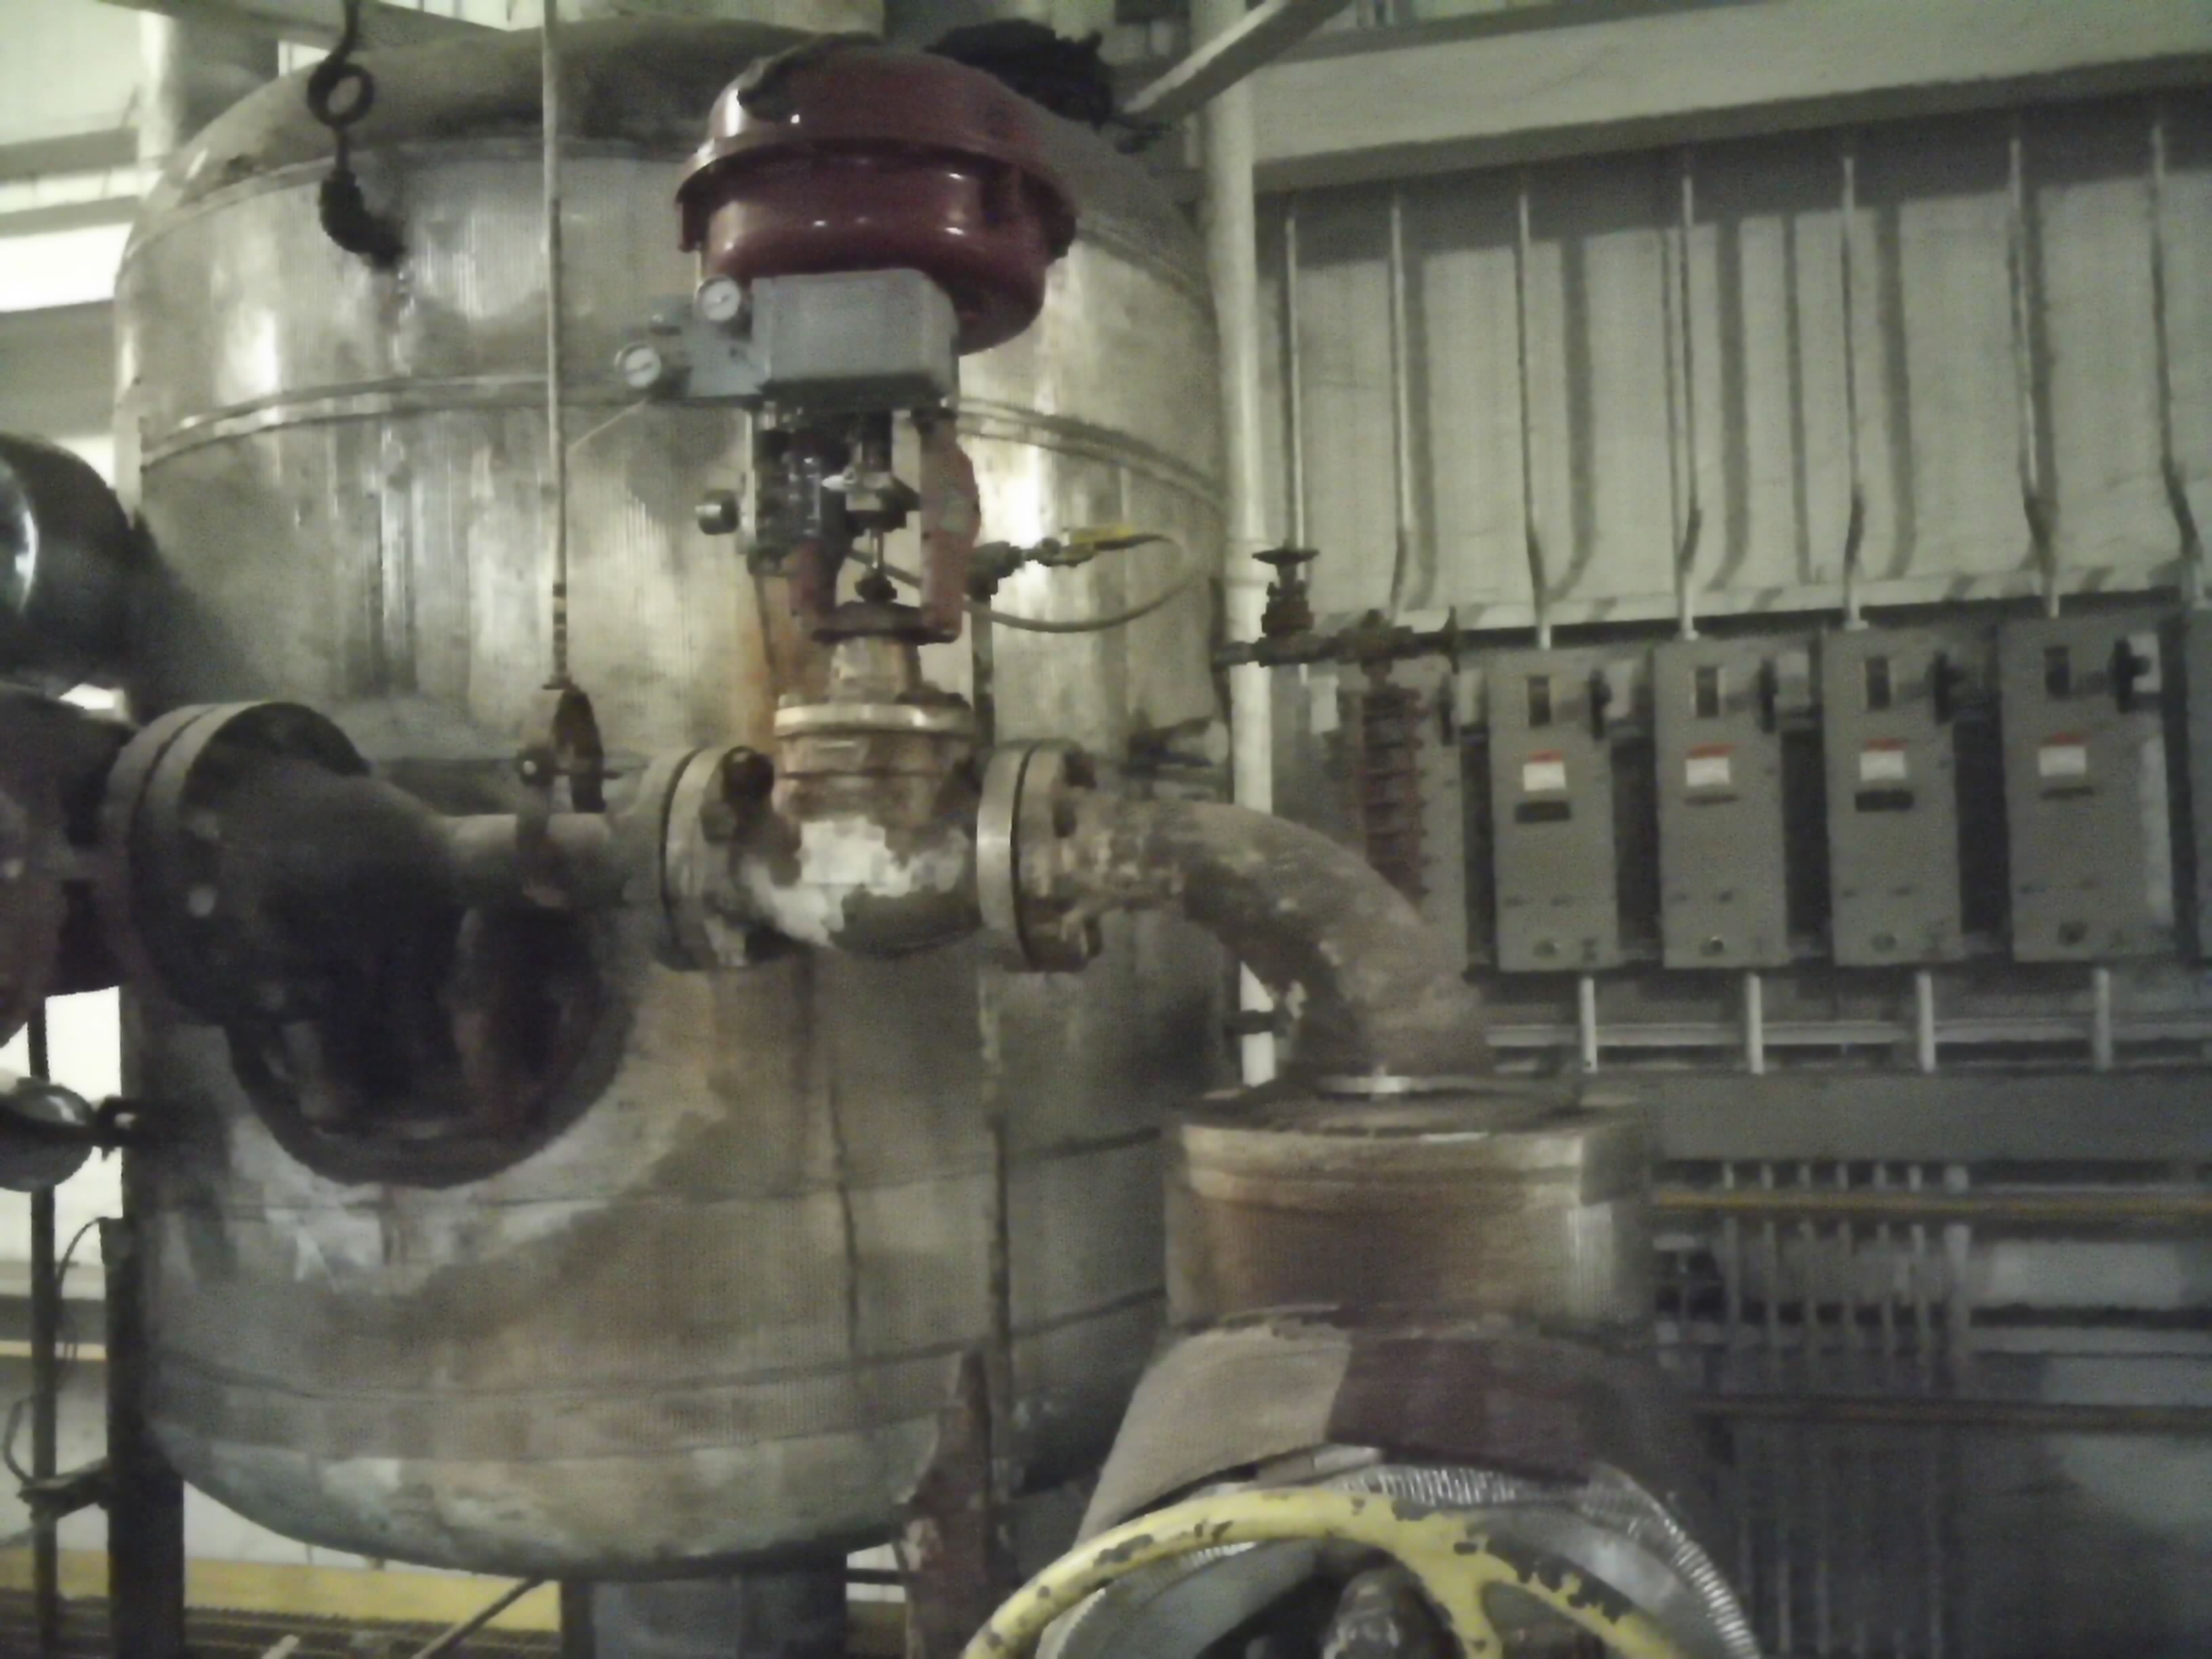
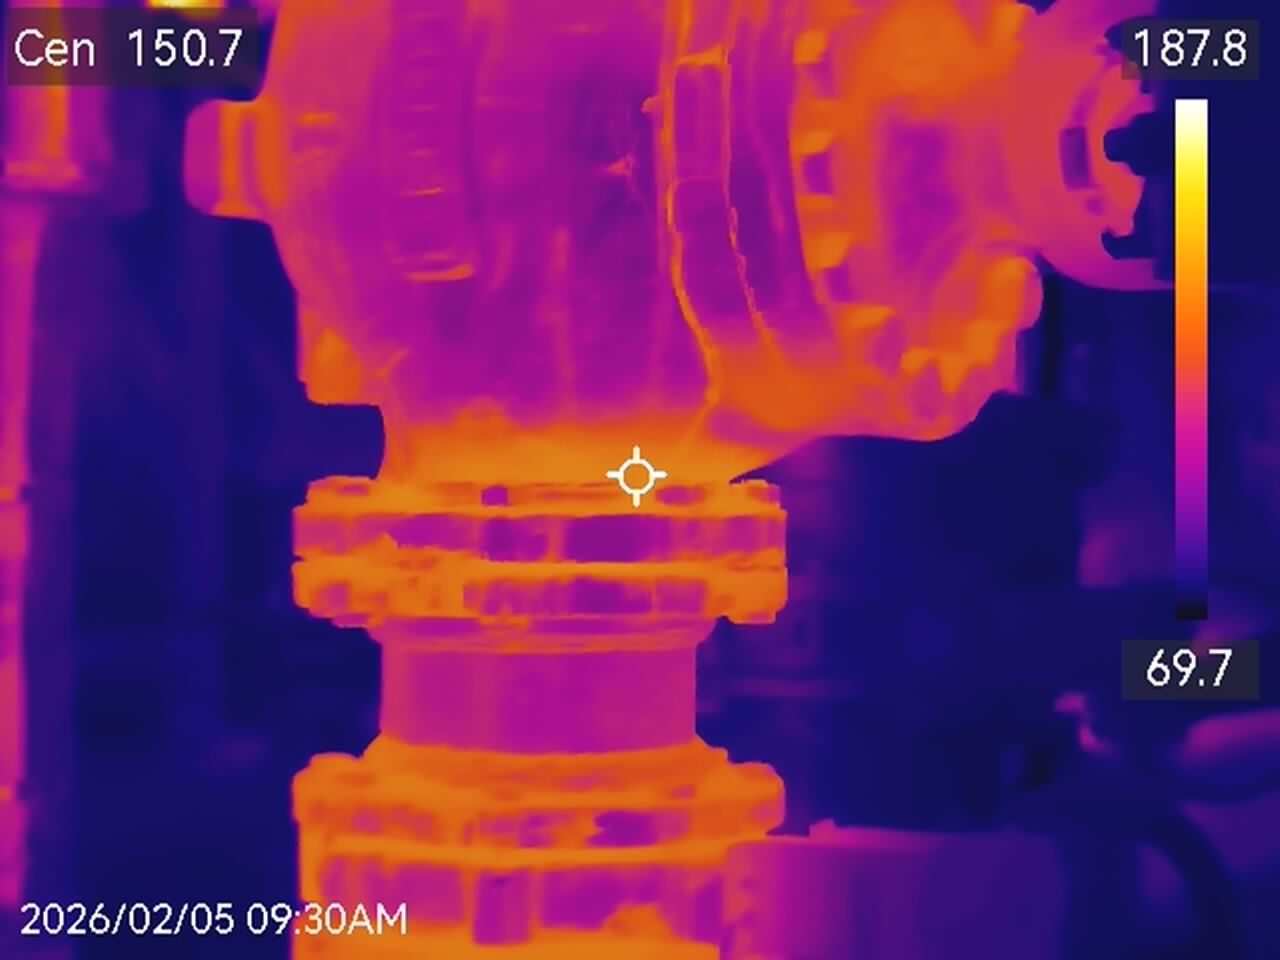
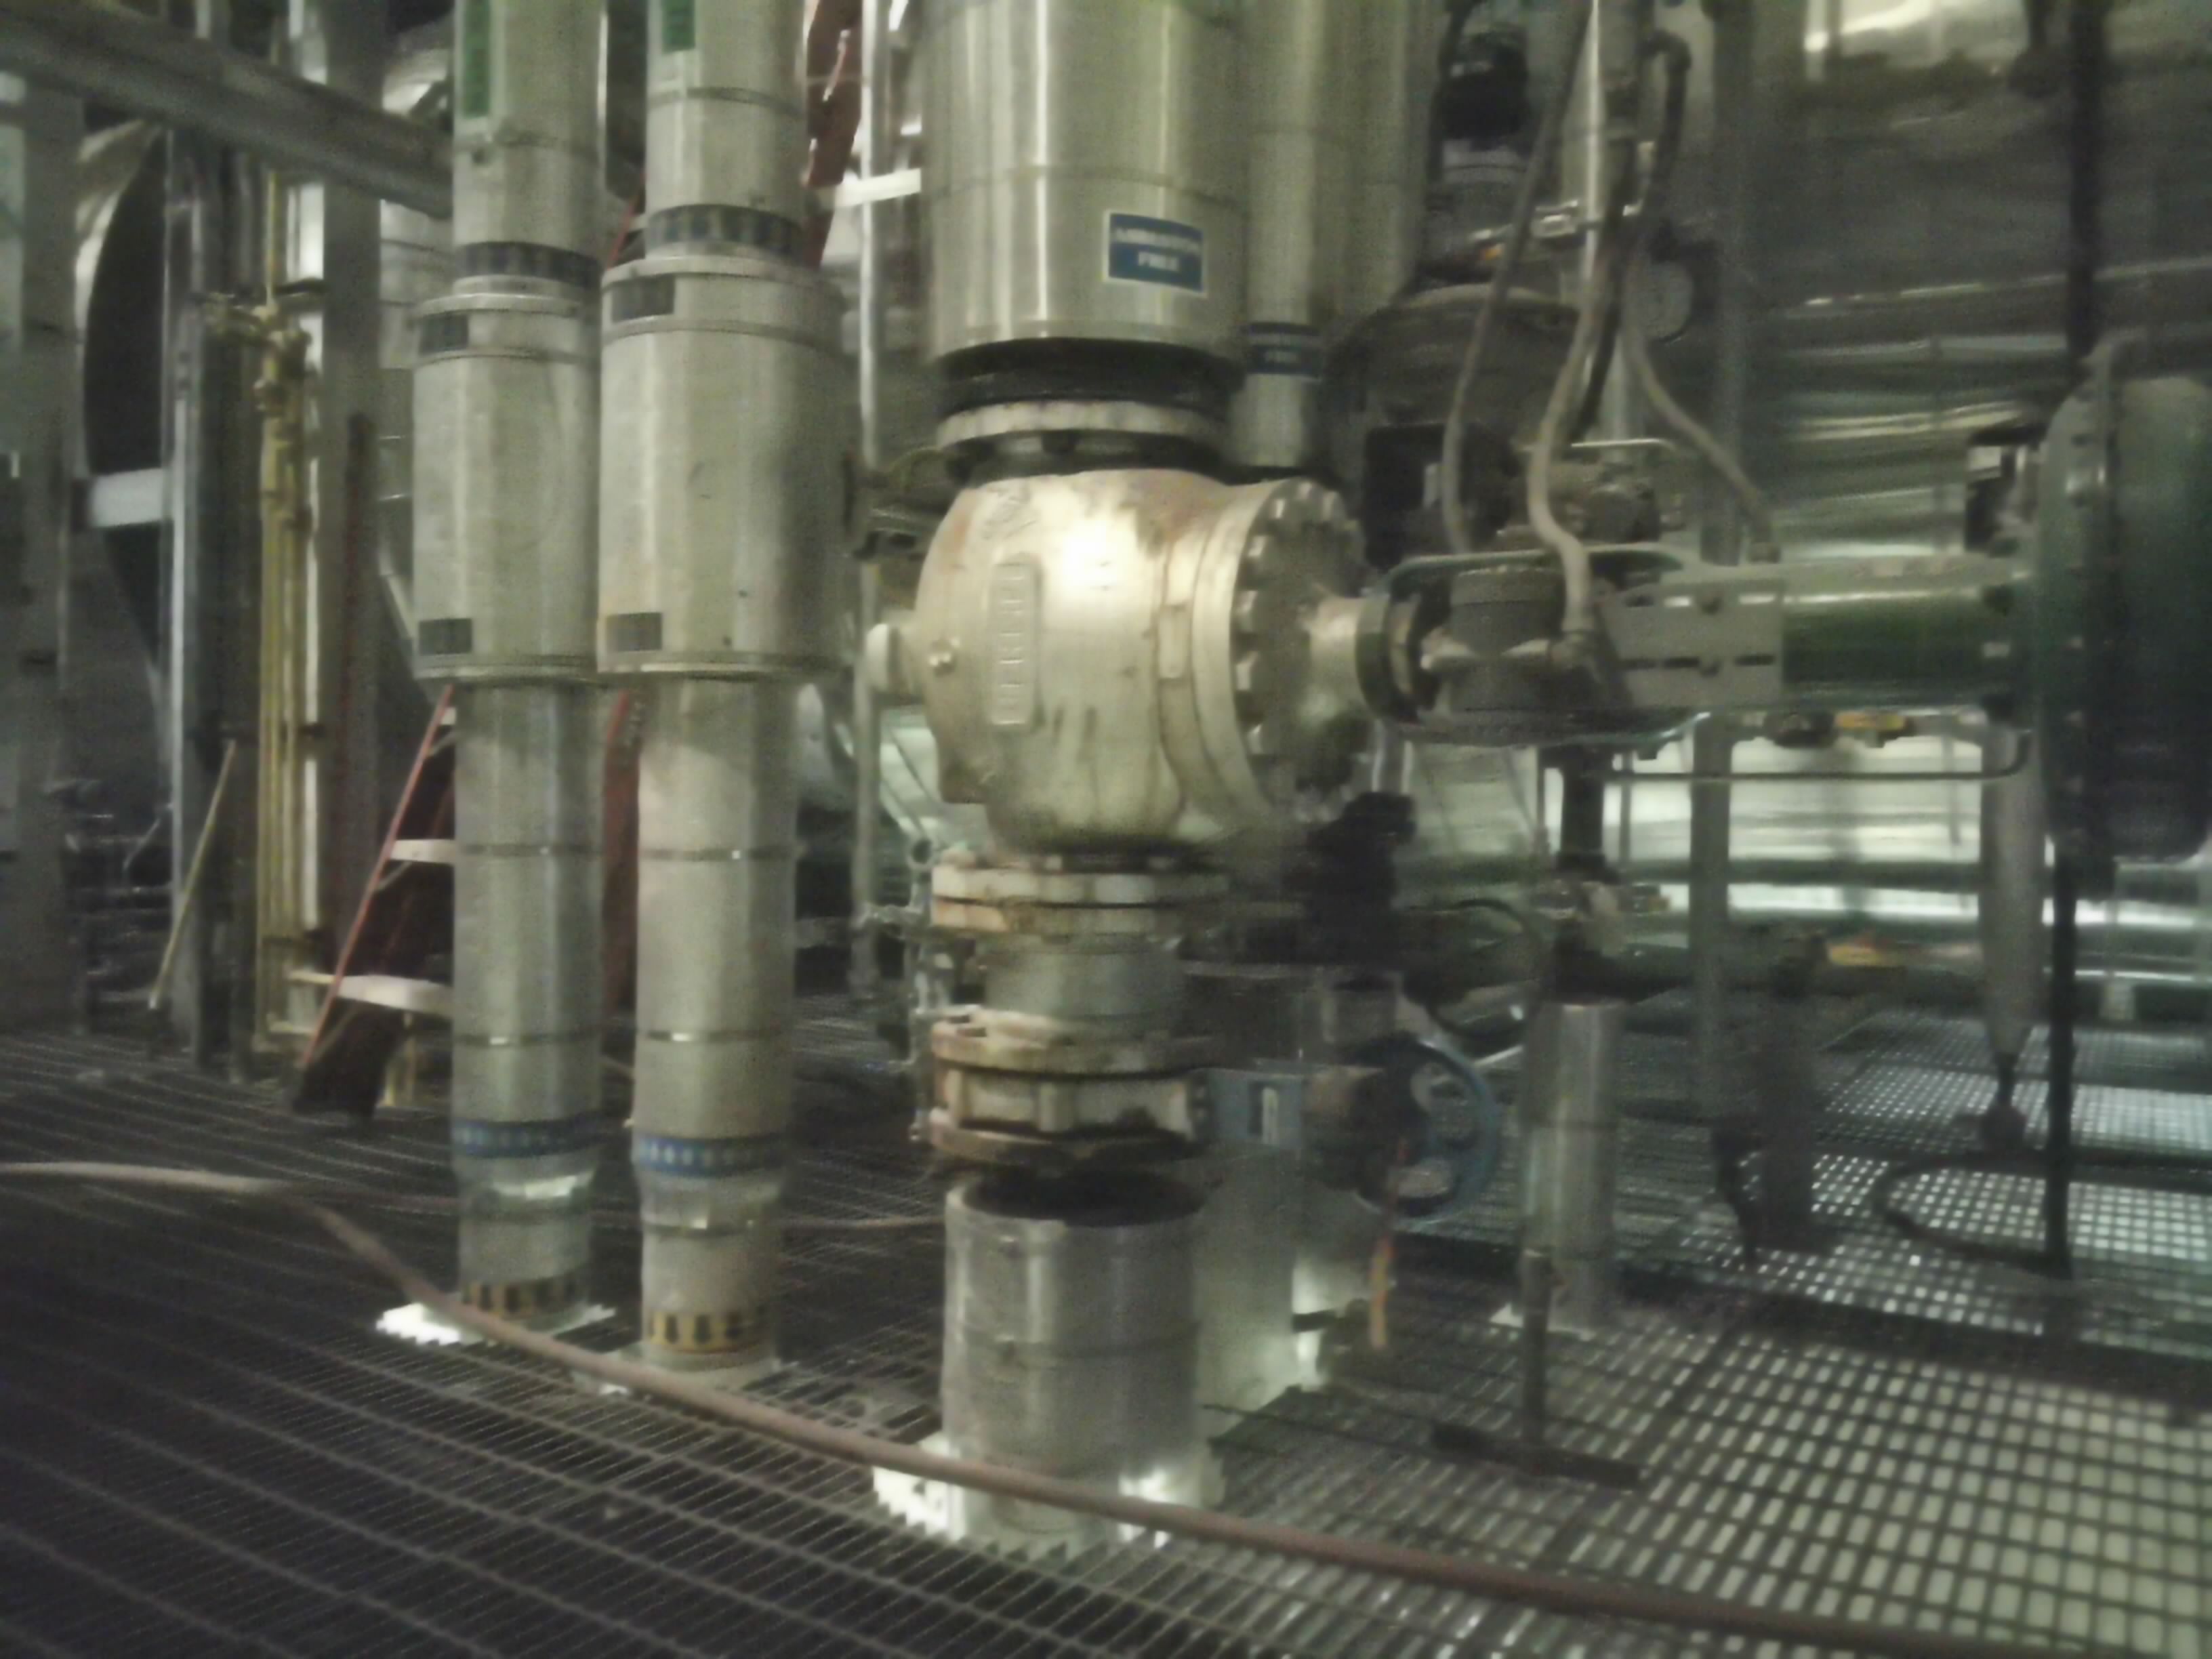
Complete per-item inventory with specifications and savings. Click the Item Description to view Thermal Images.

#DescriptionPipeQtyTemp °FInv. Ins.Upg. Ins.Inv ThkUpg ThkCurrent $/yrUpgraded $/yrSavings $/yrHeat kBtu/yrCO₂ MT/yr
Thermal Imaging

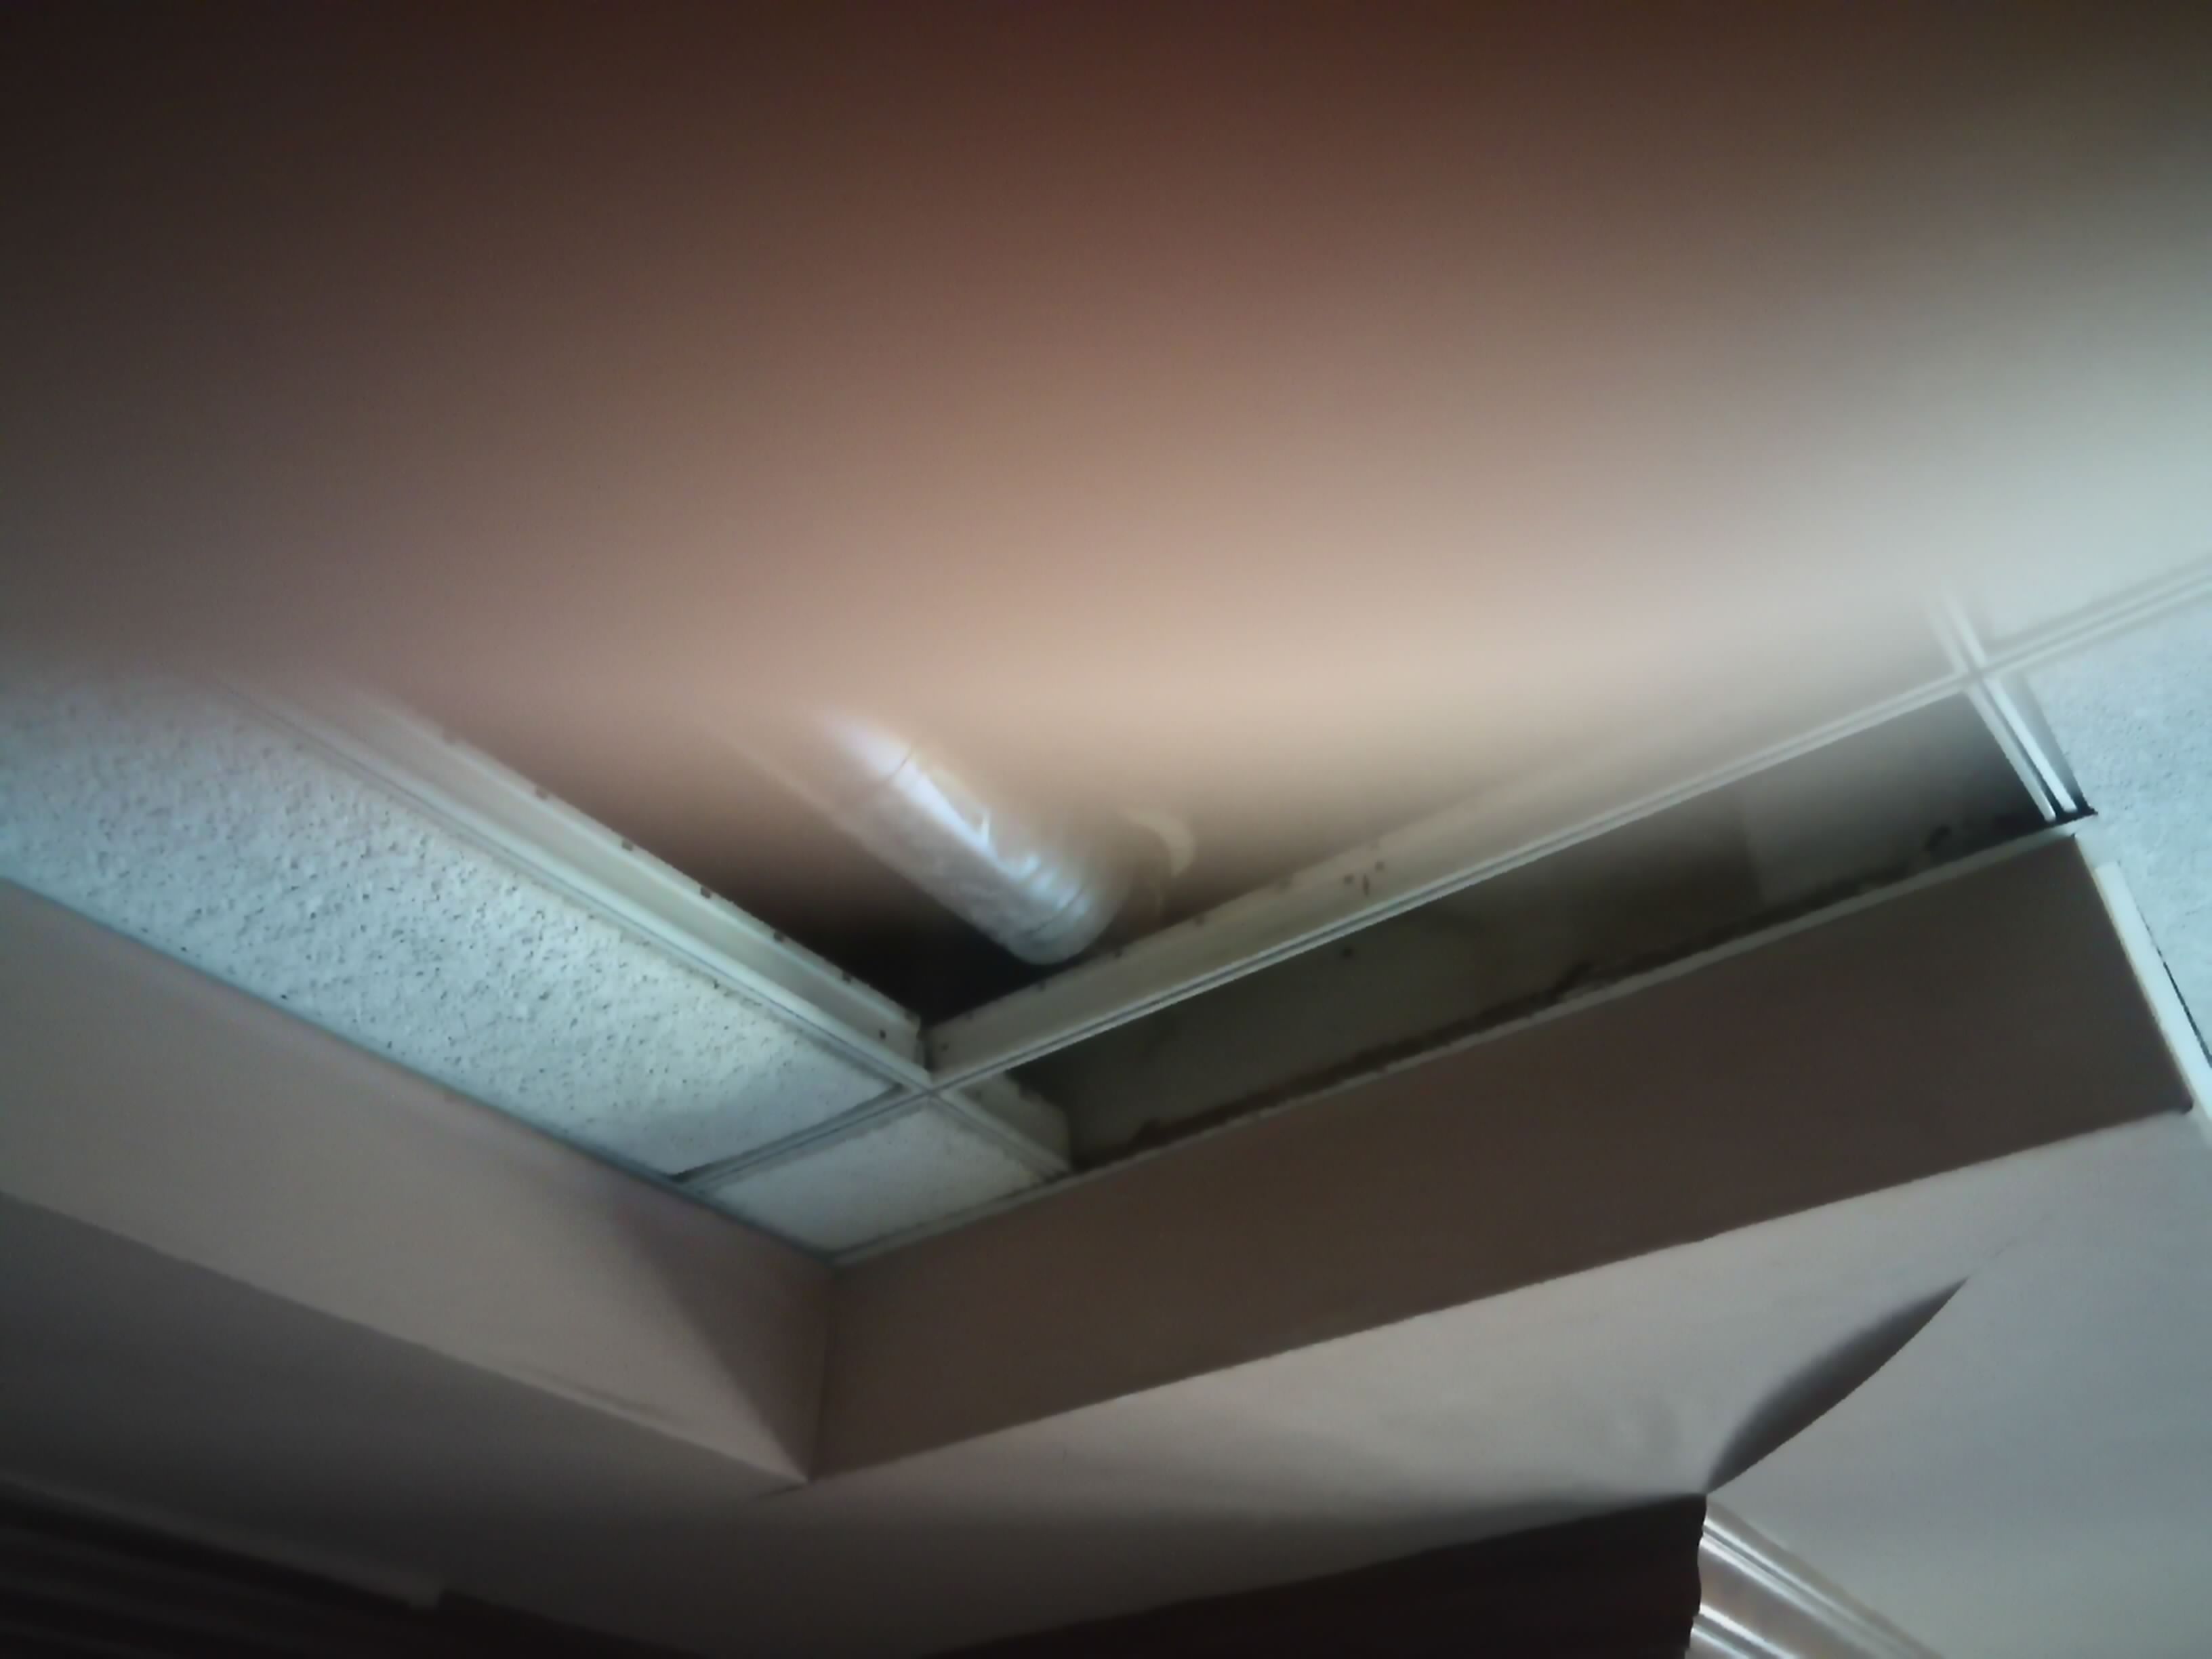
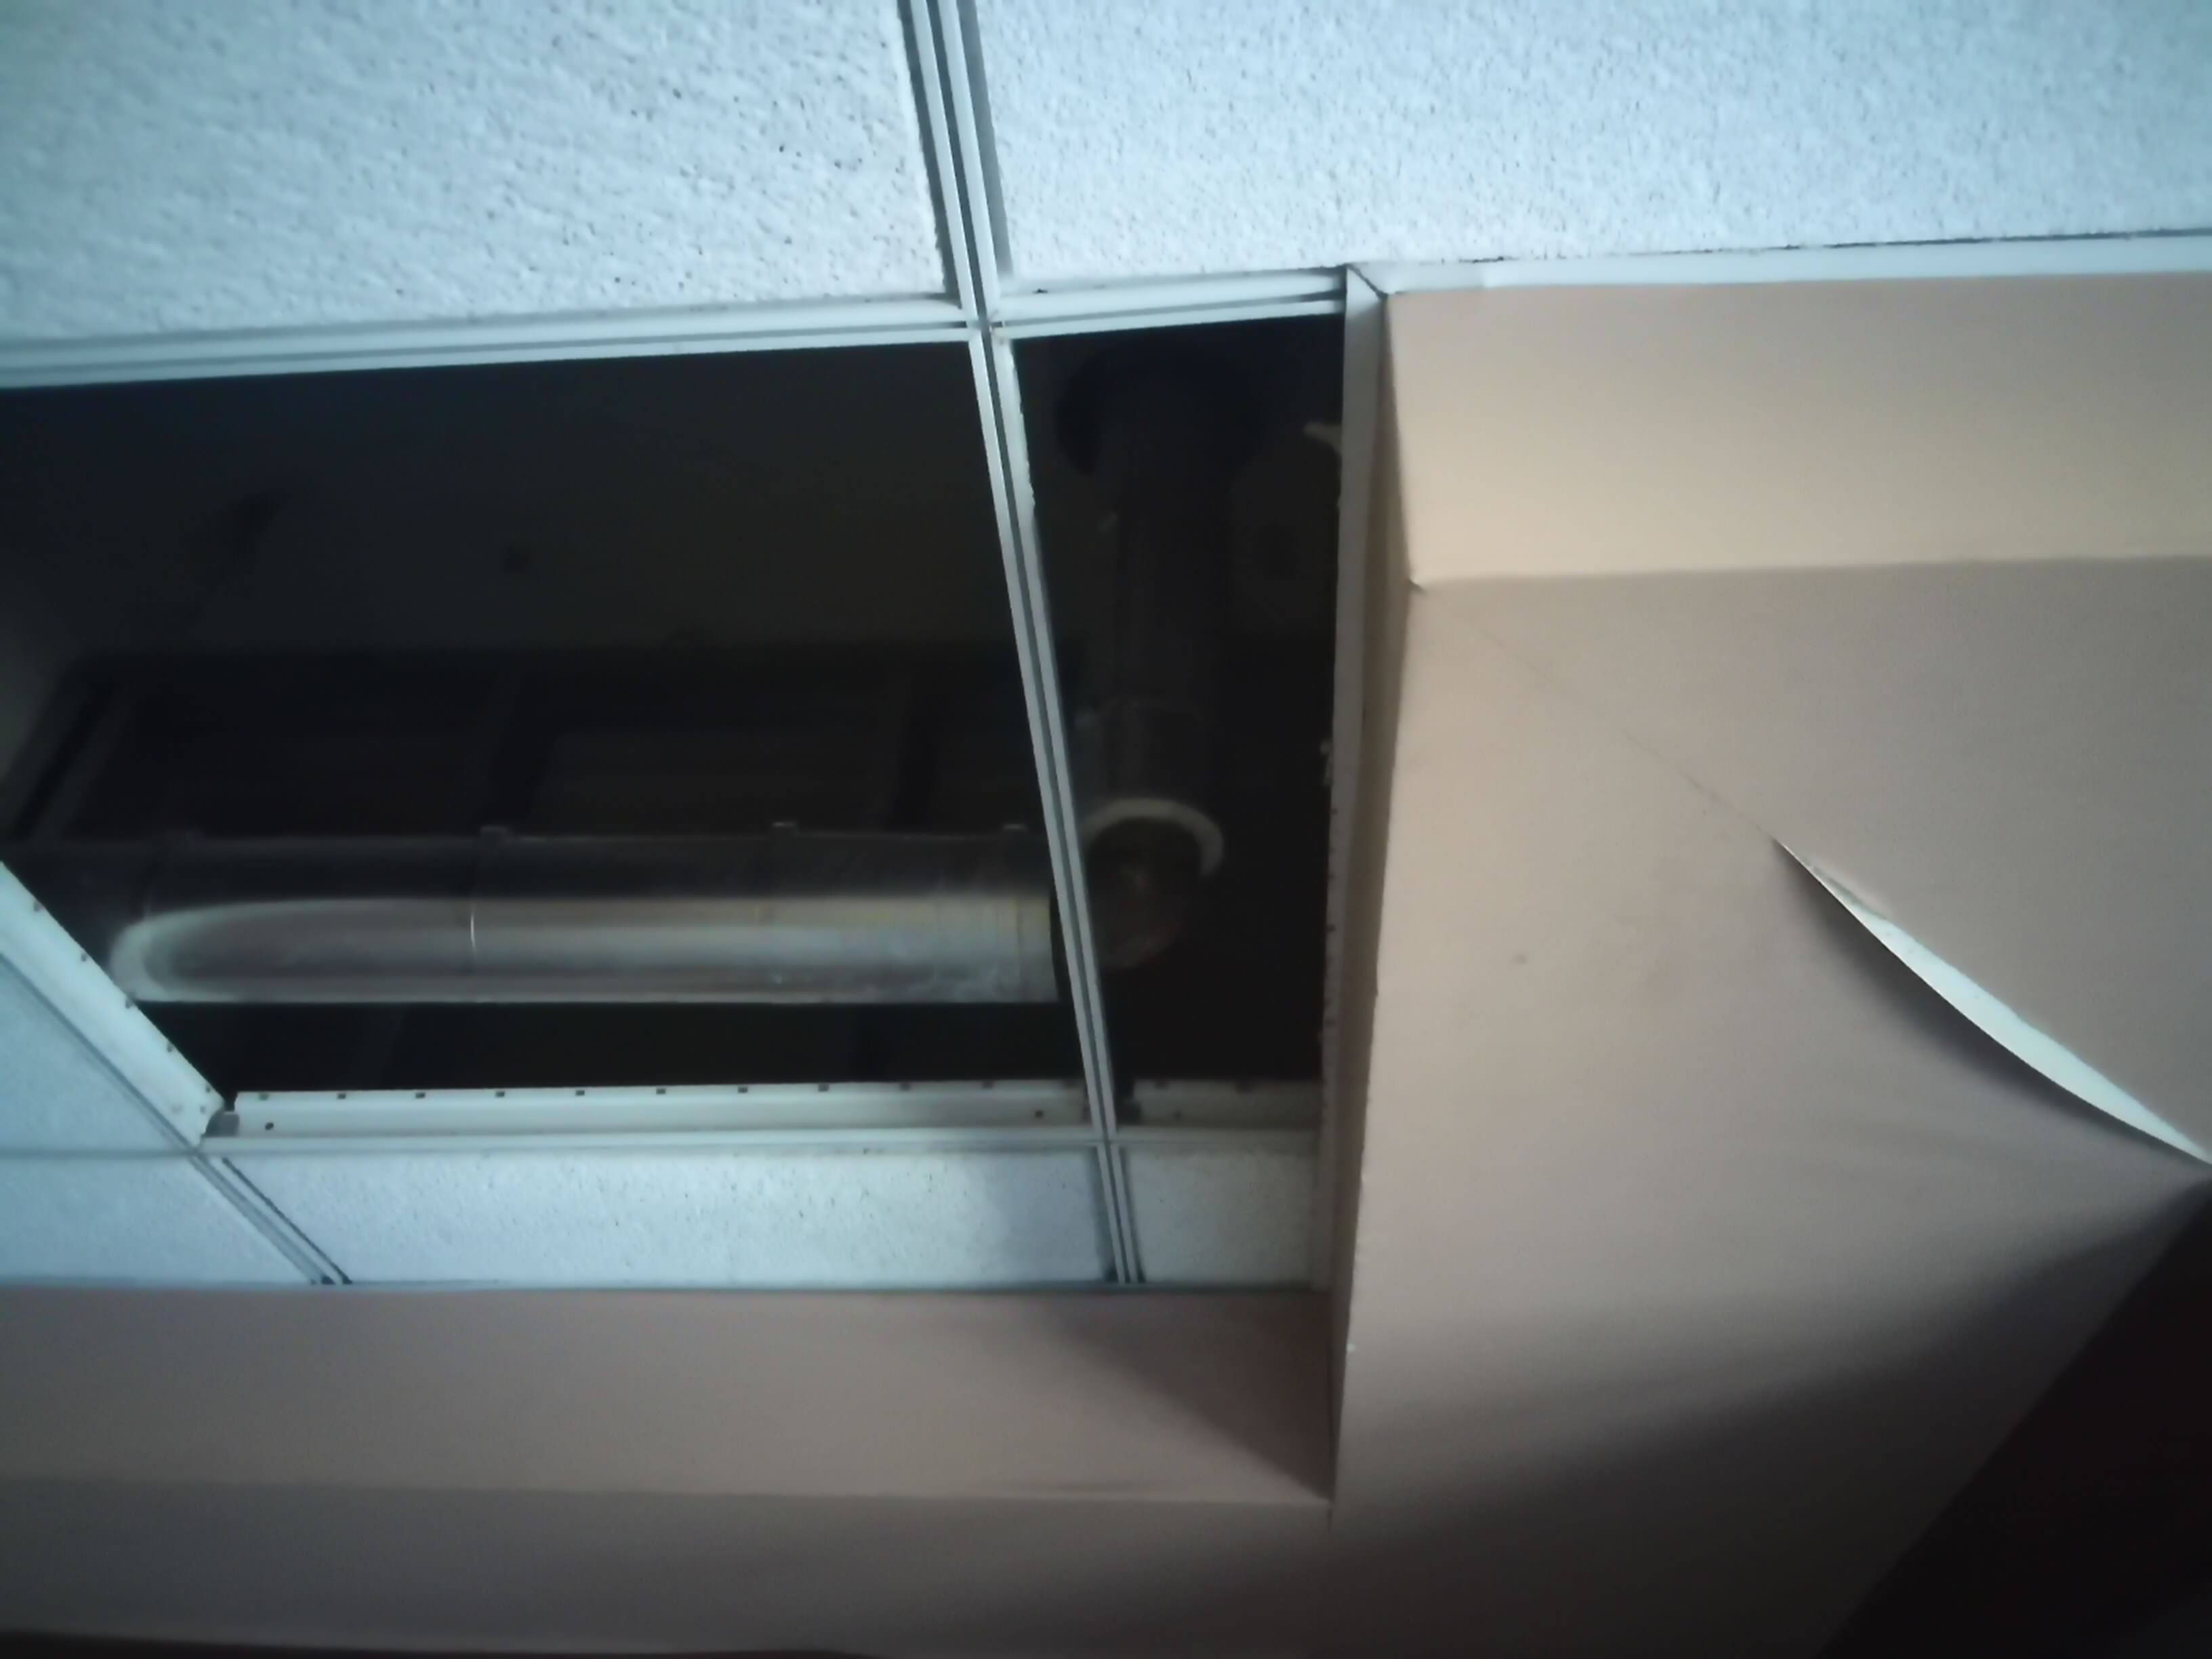
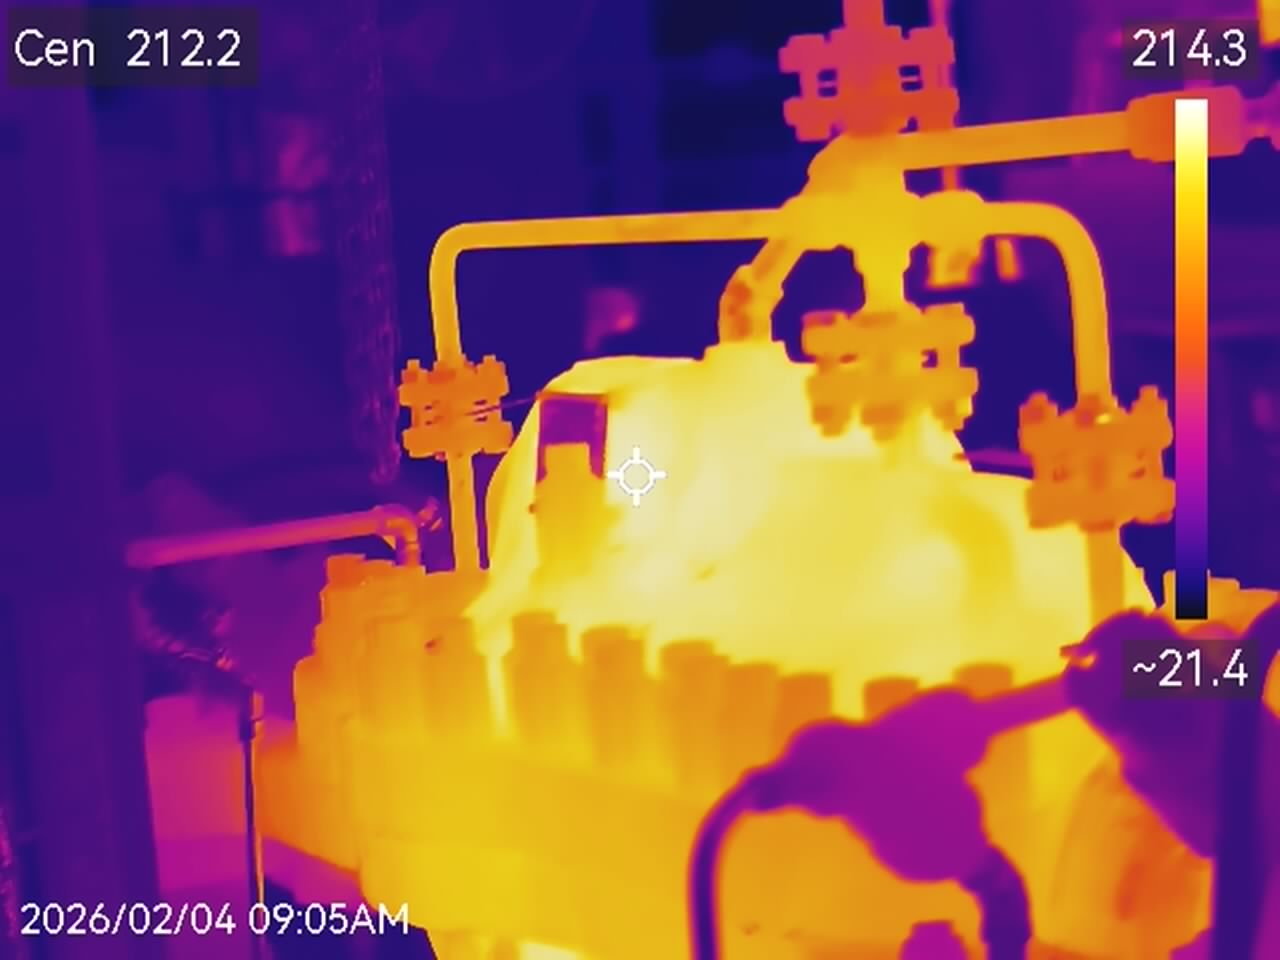
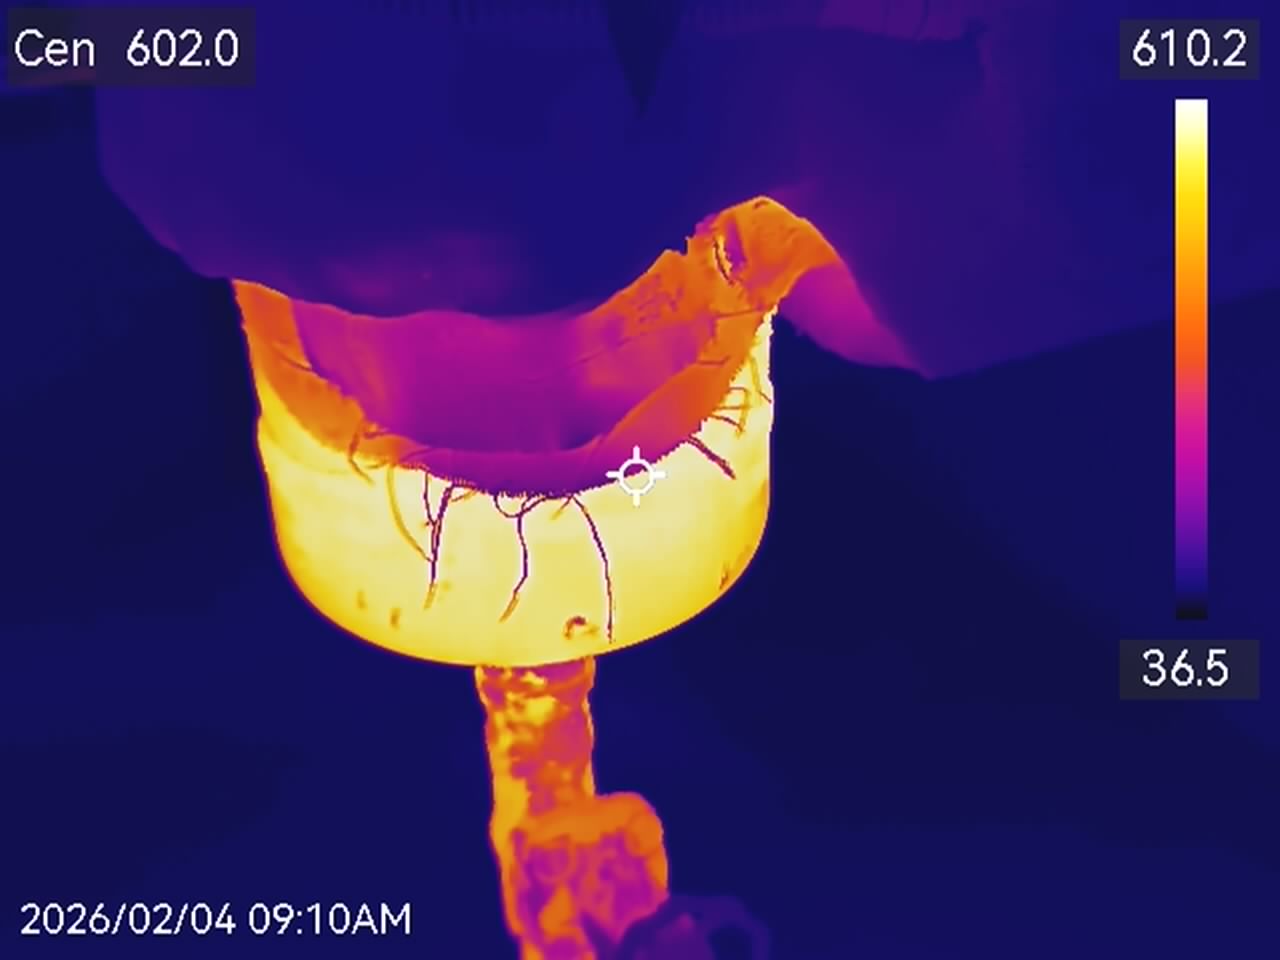
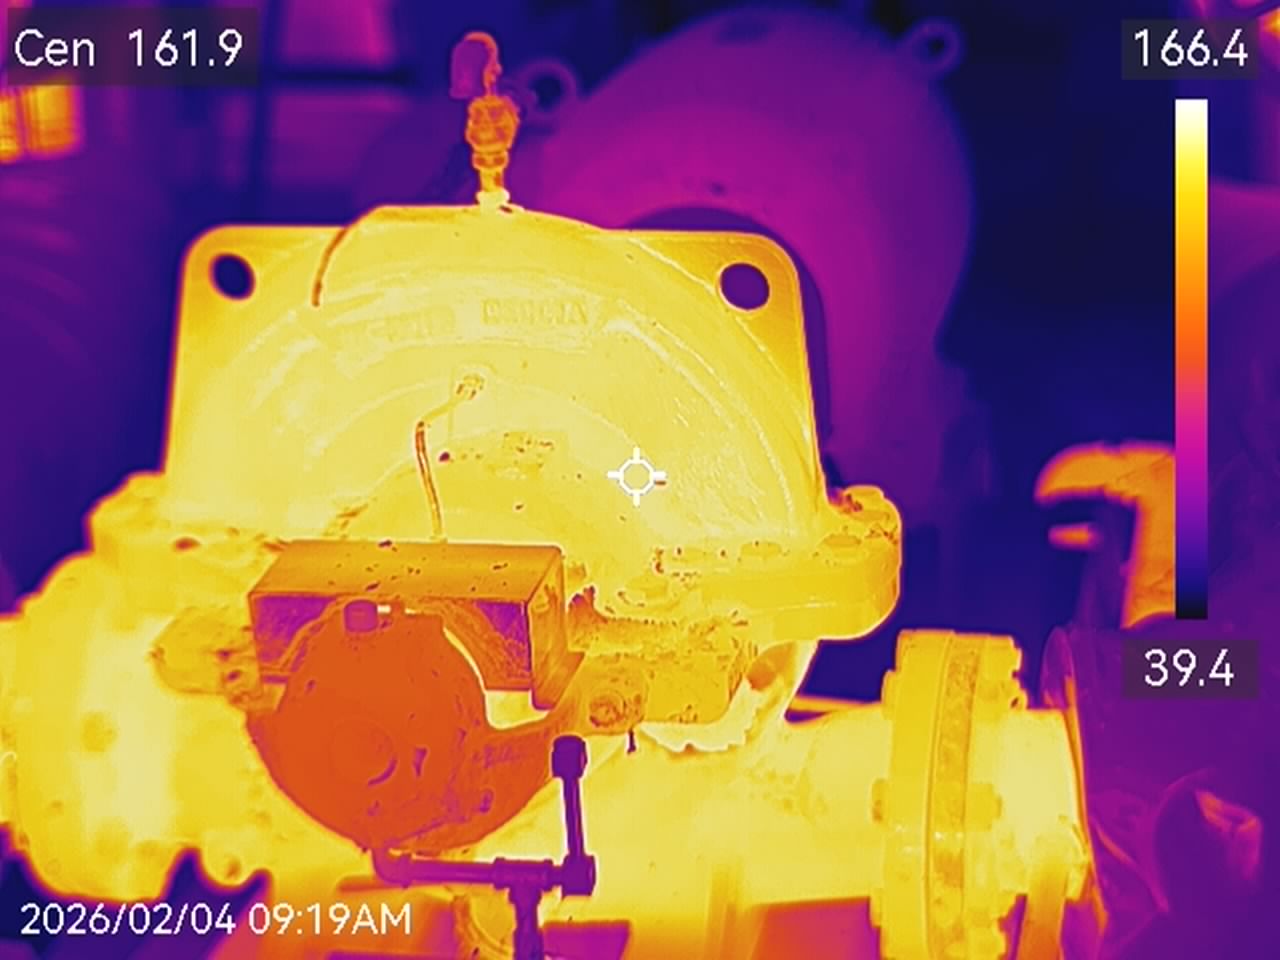
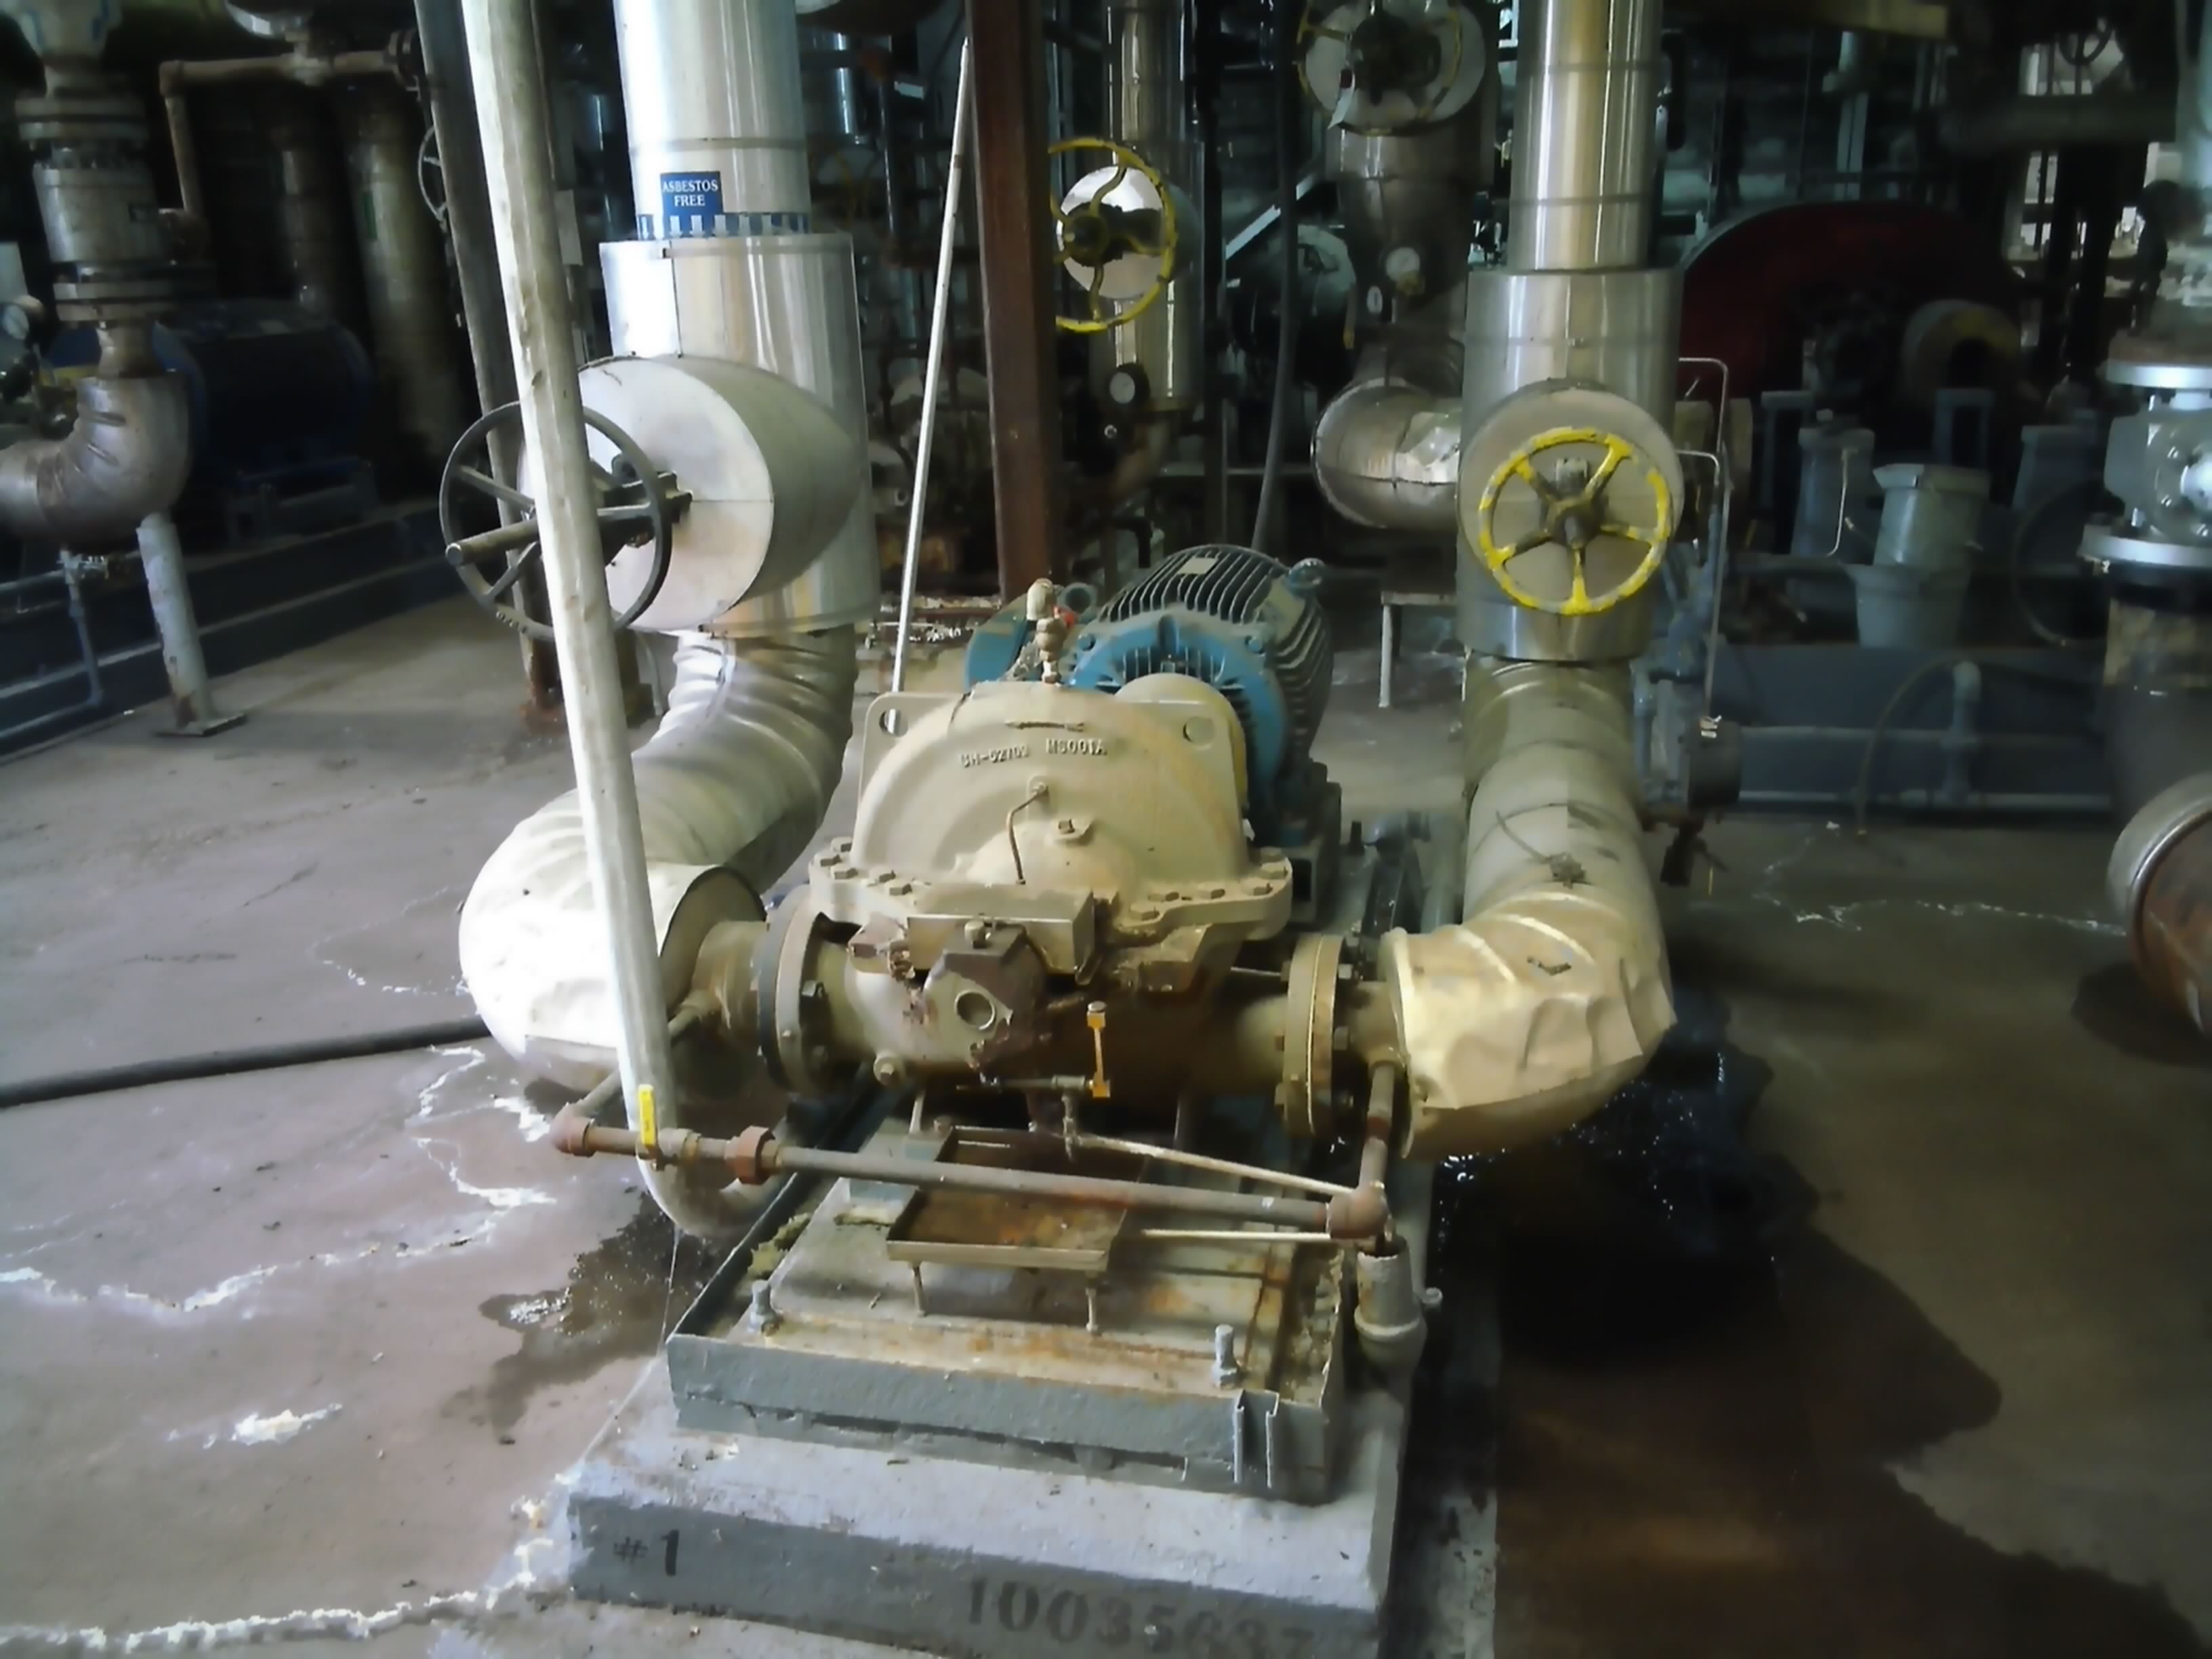
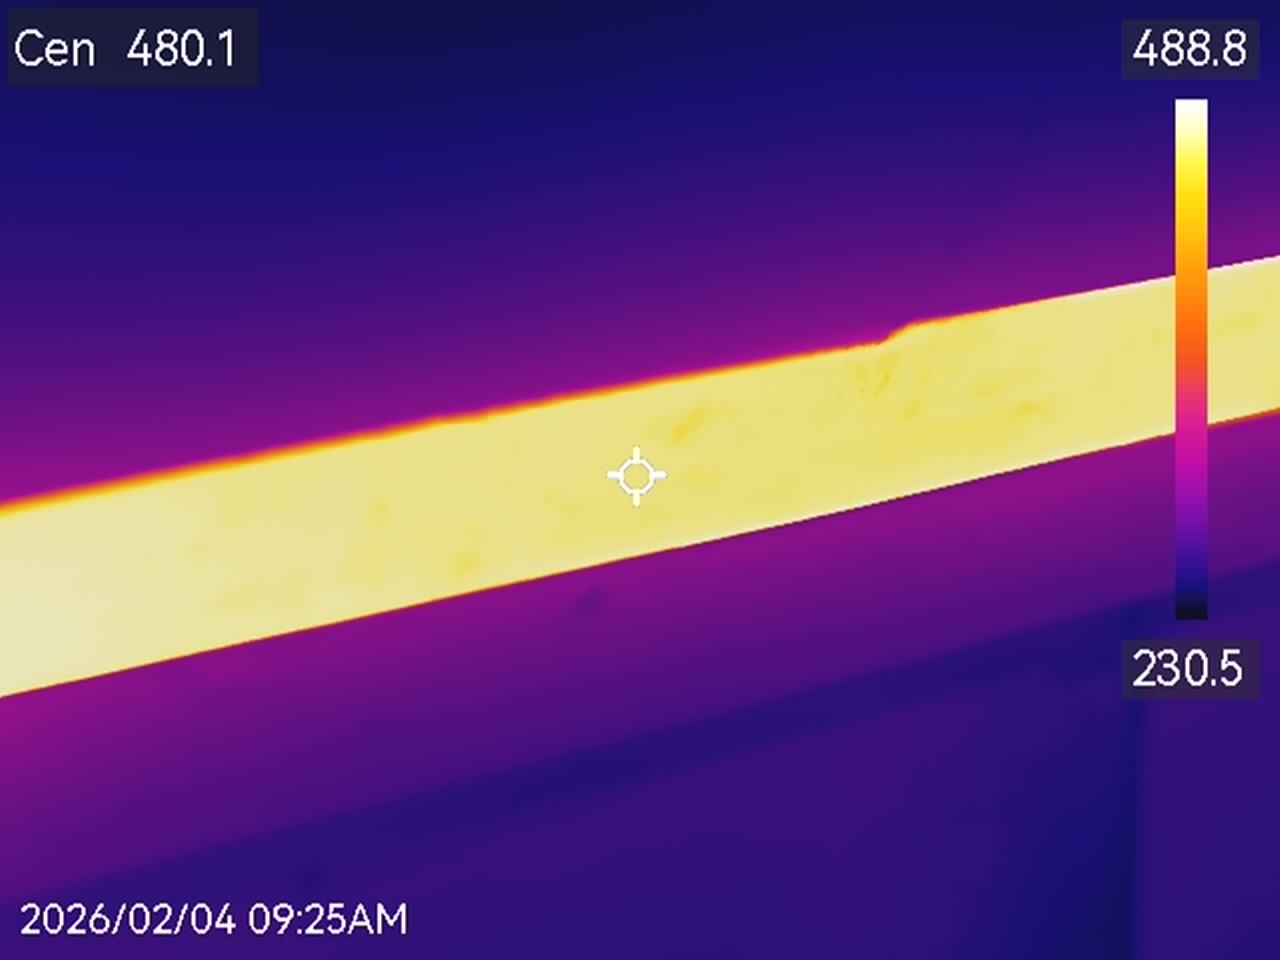
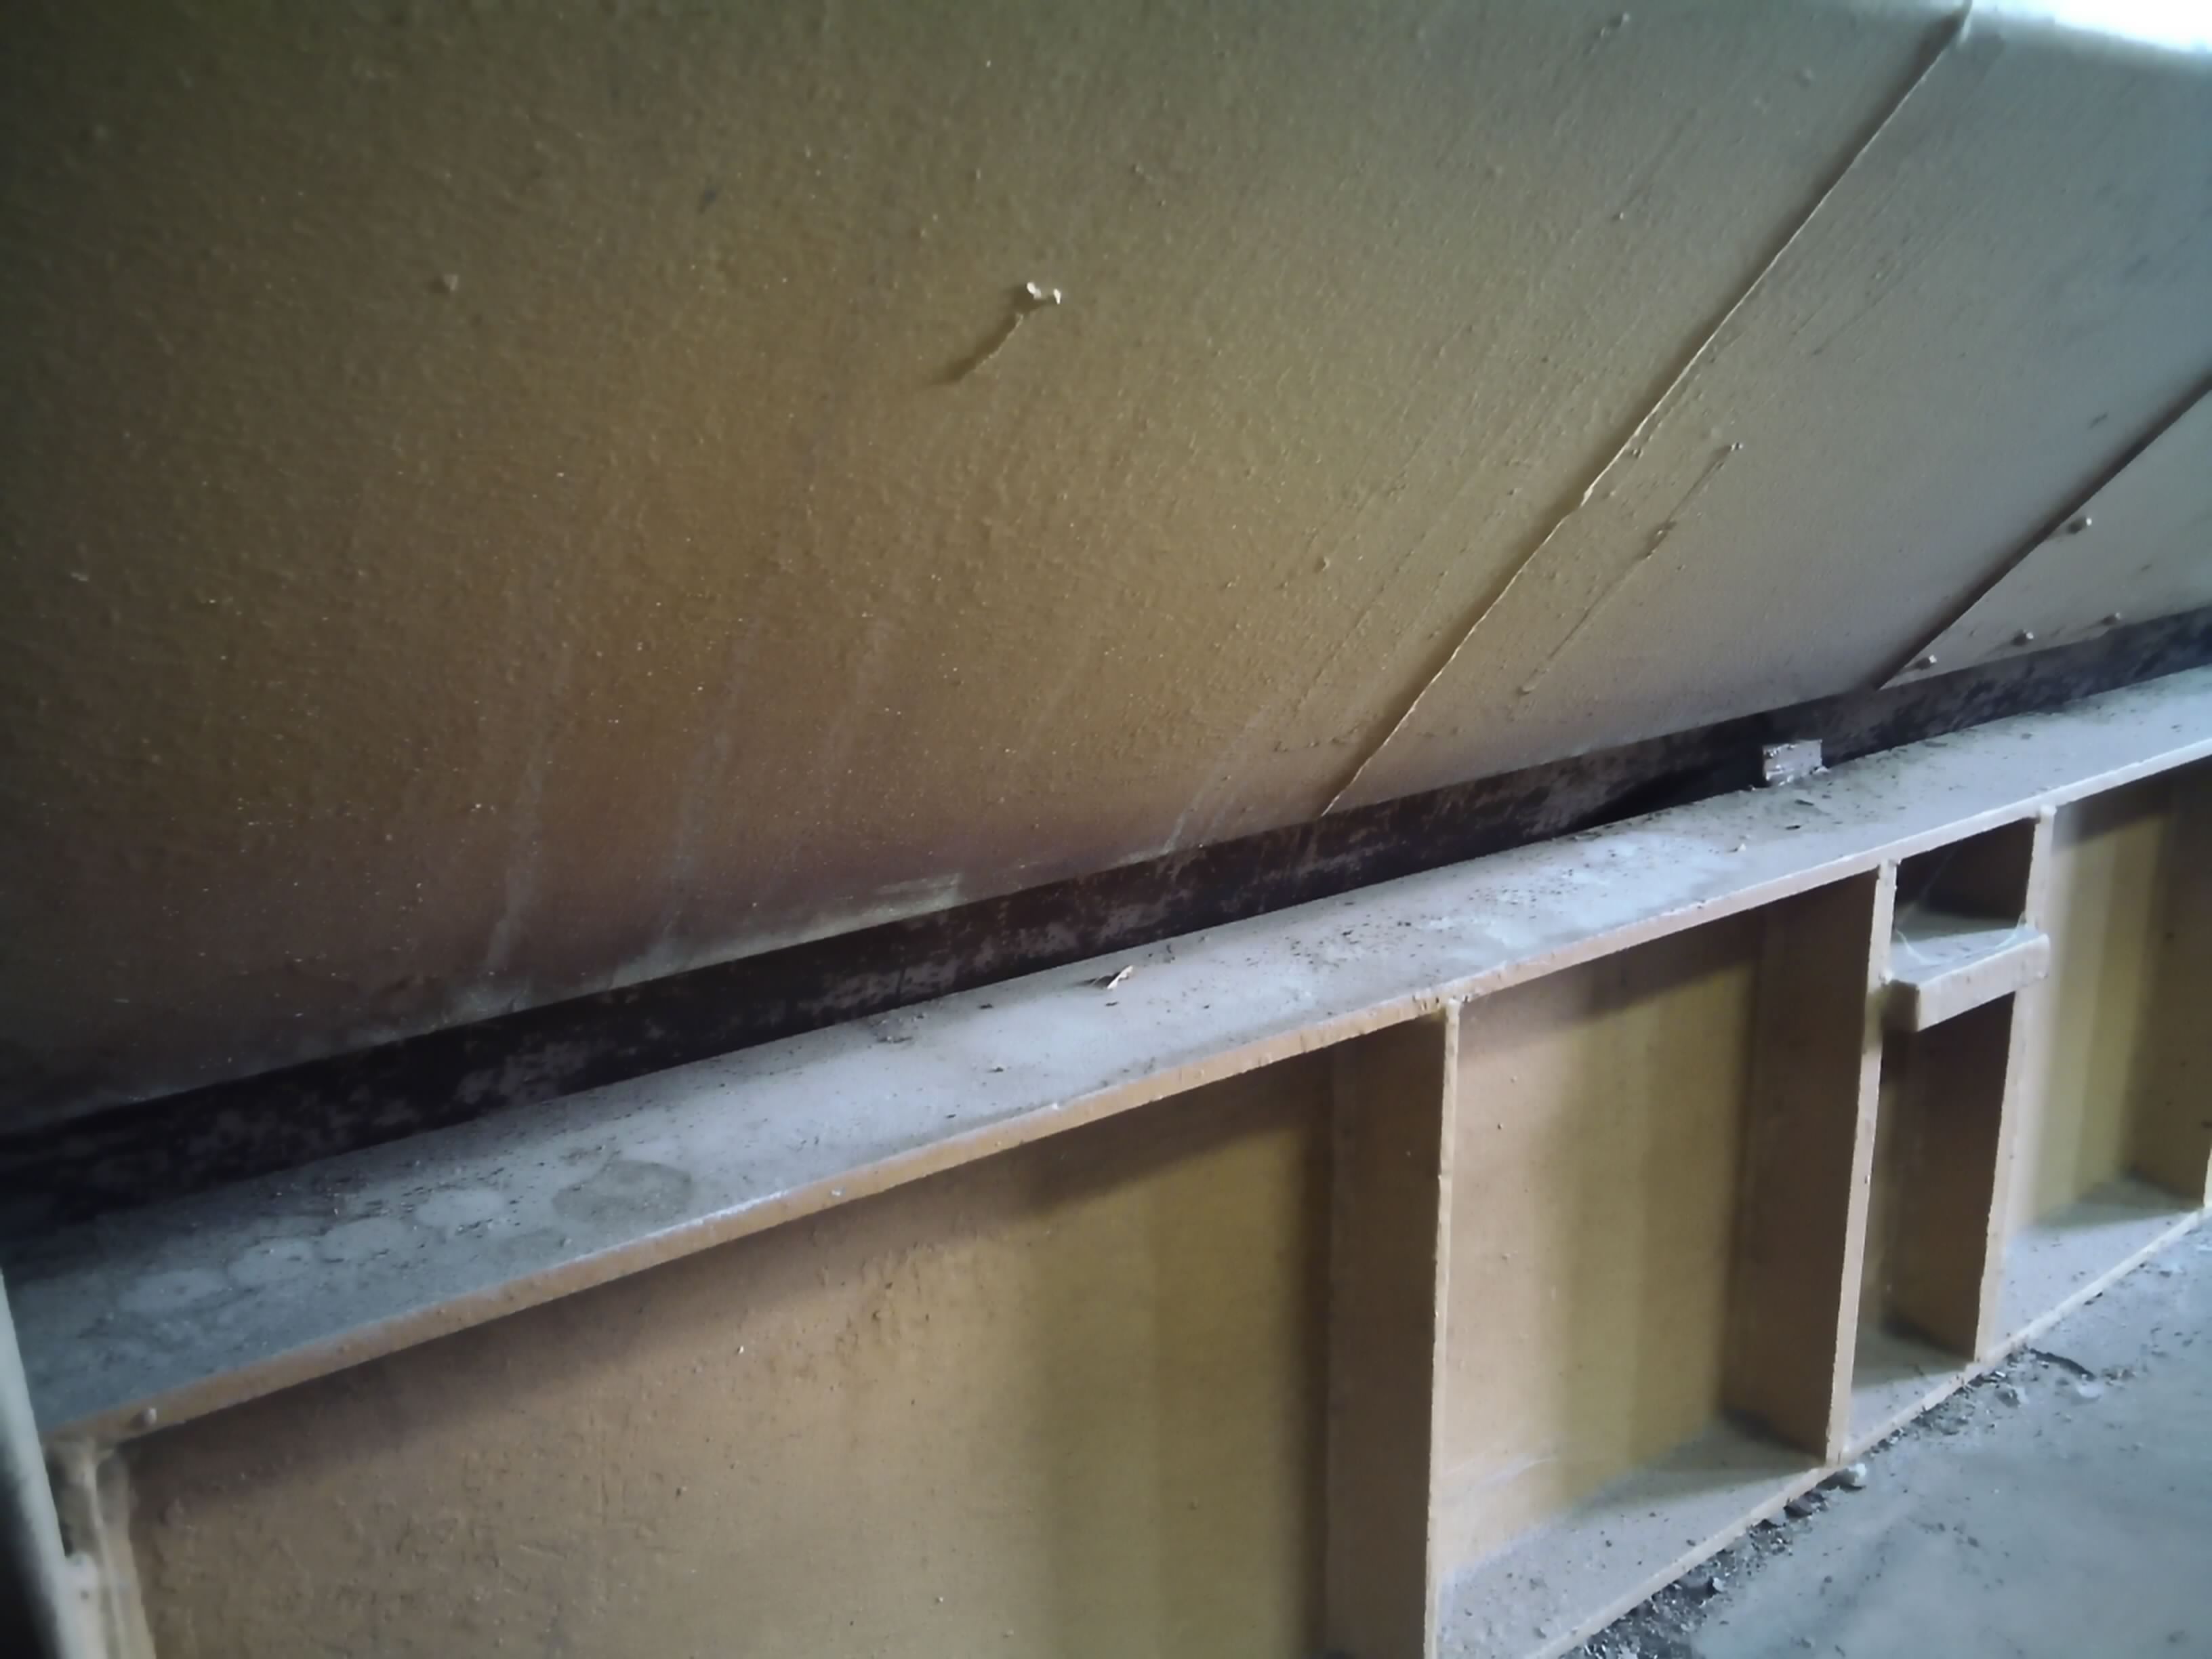
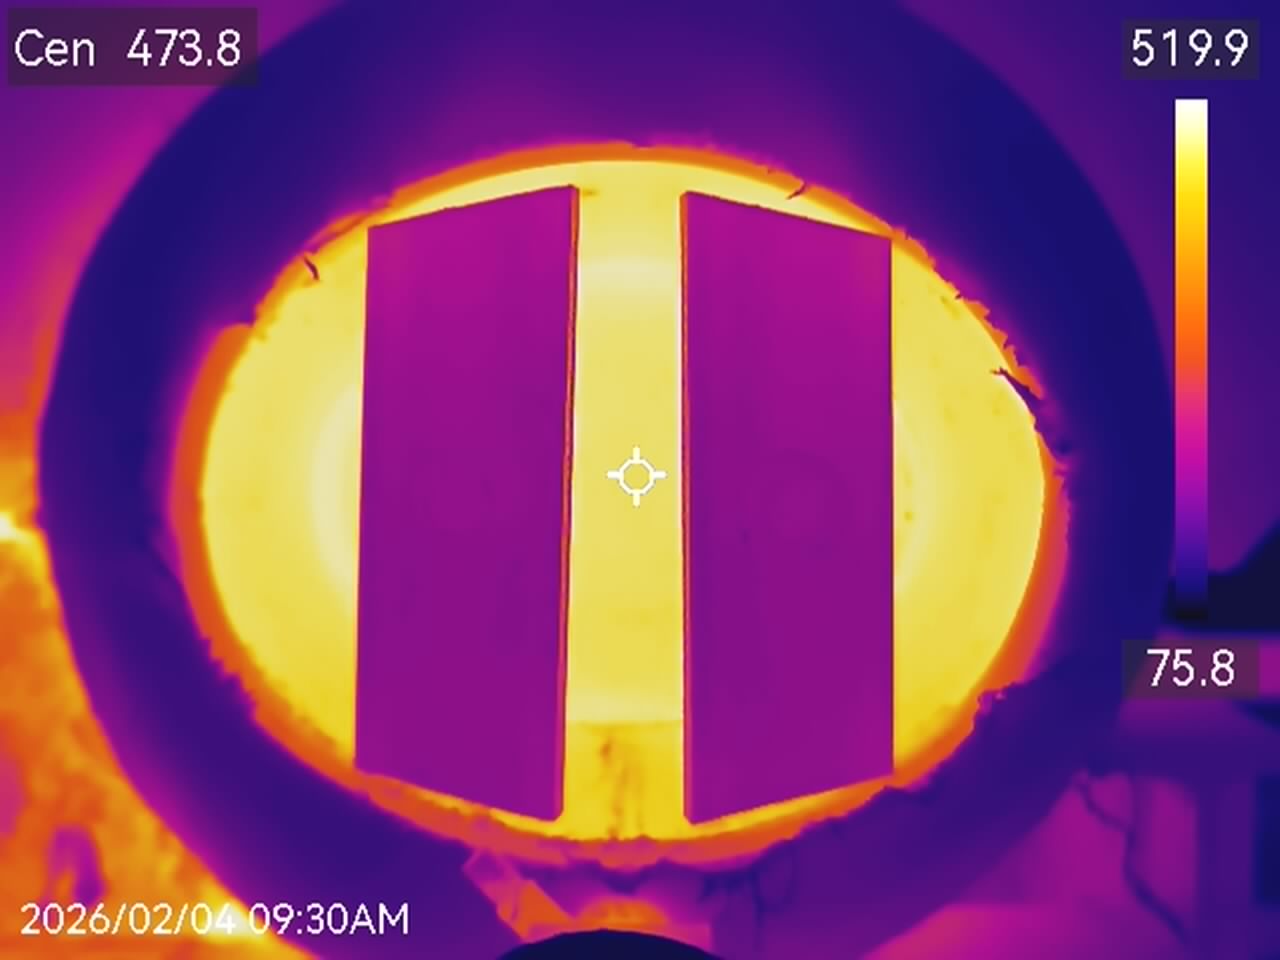
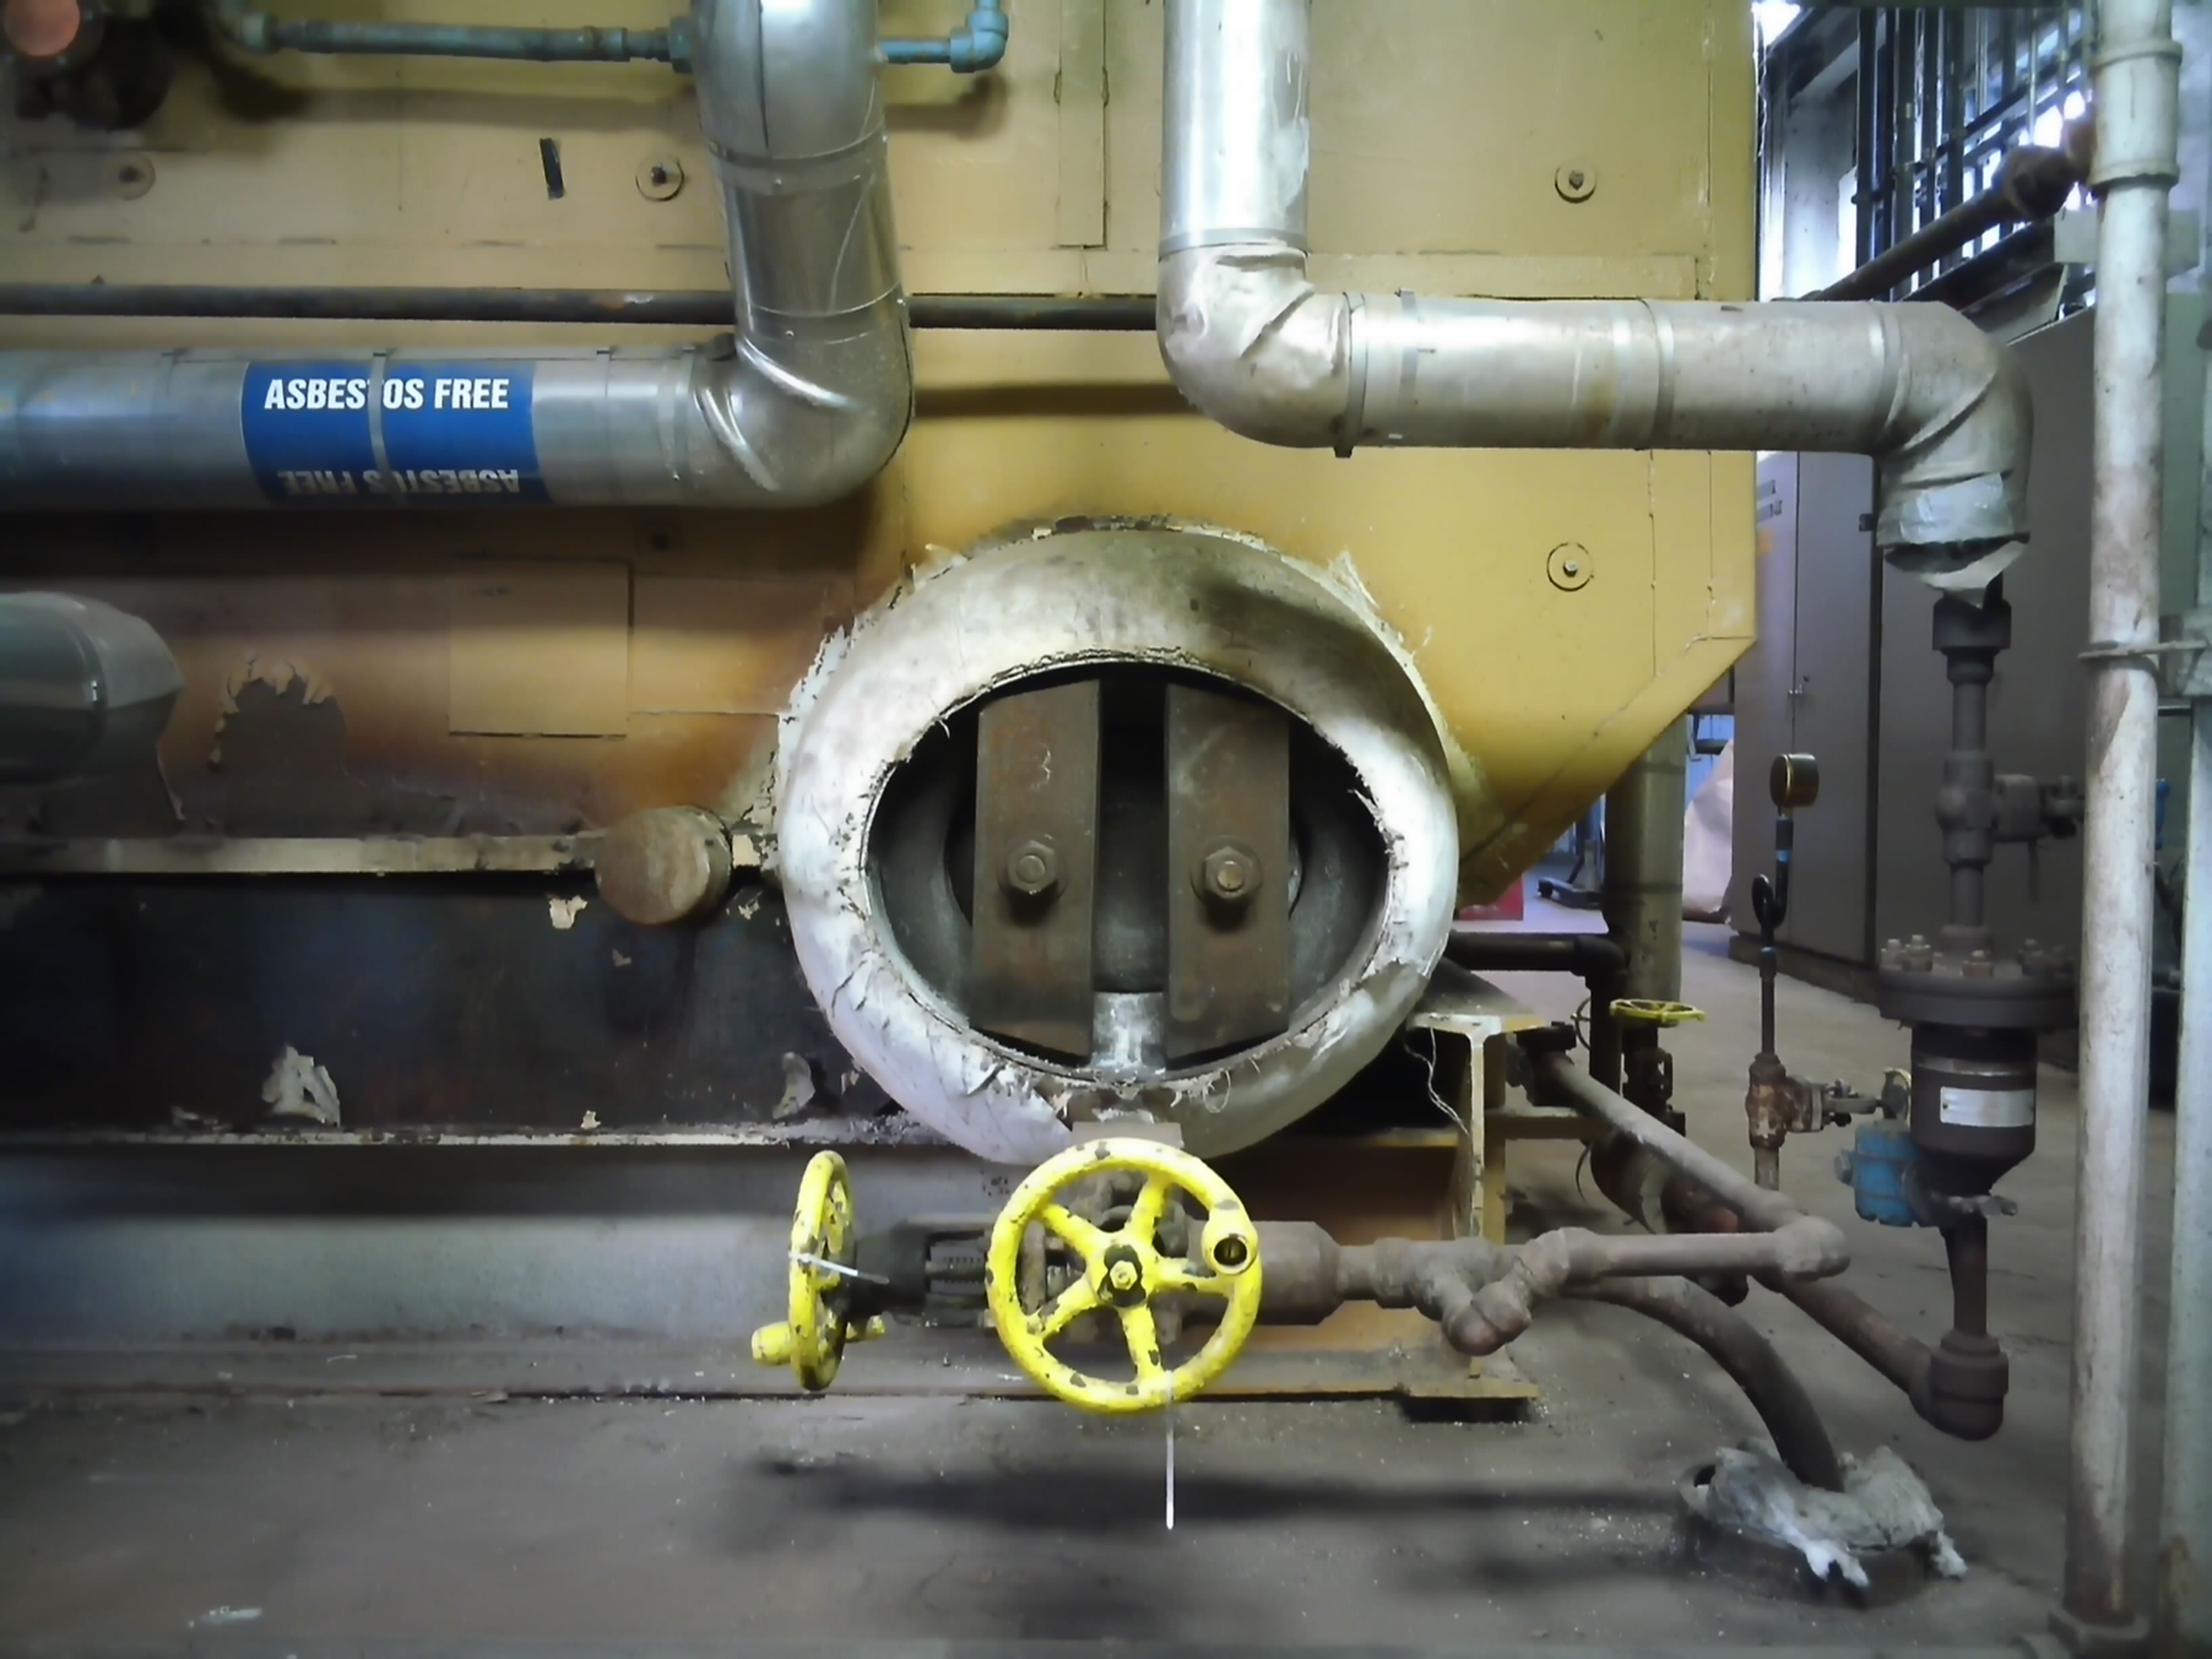
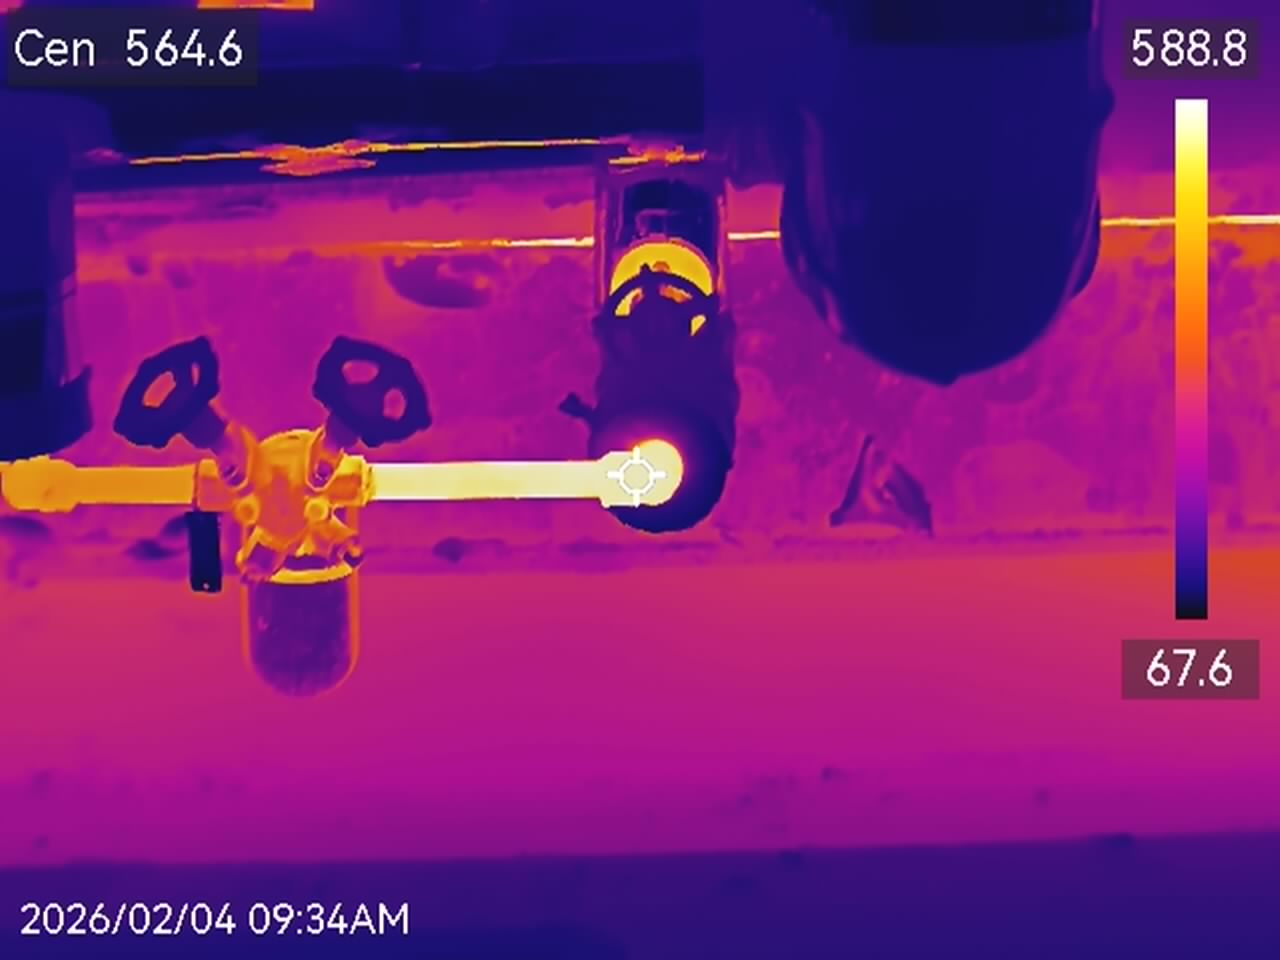
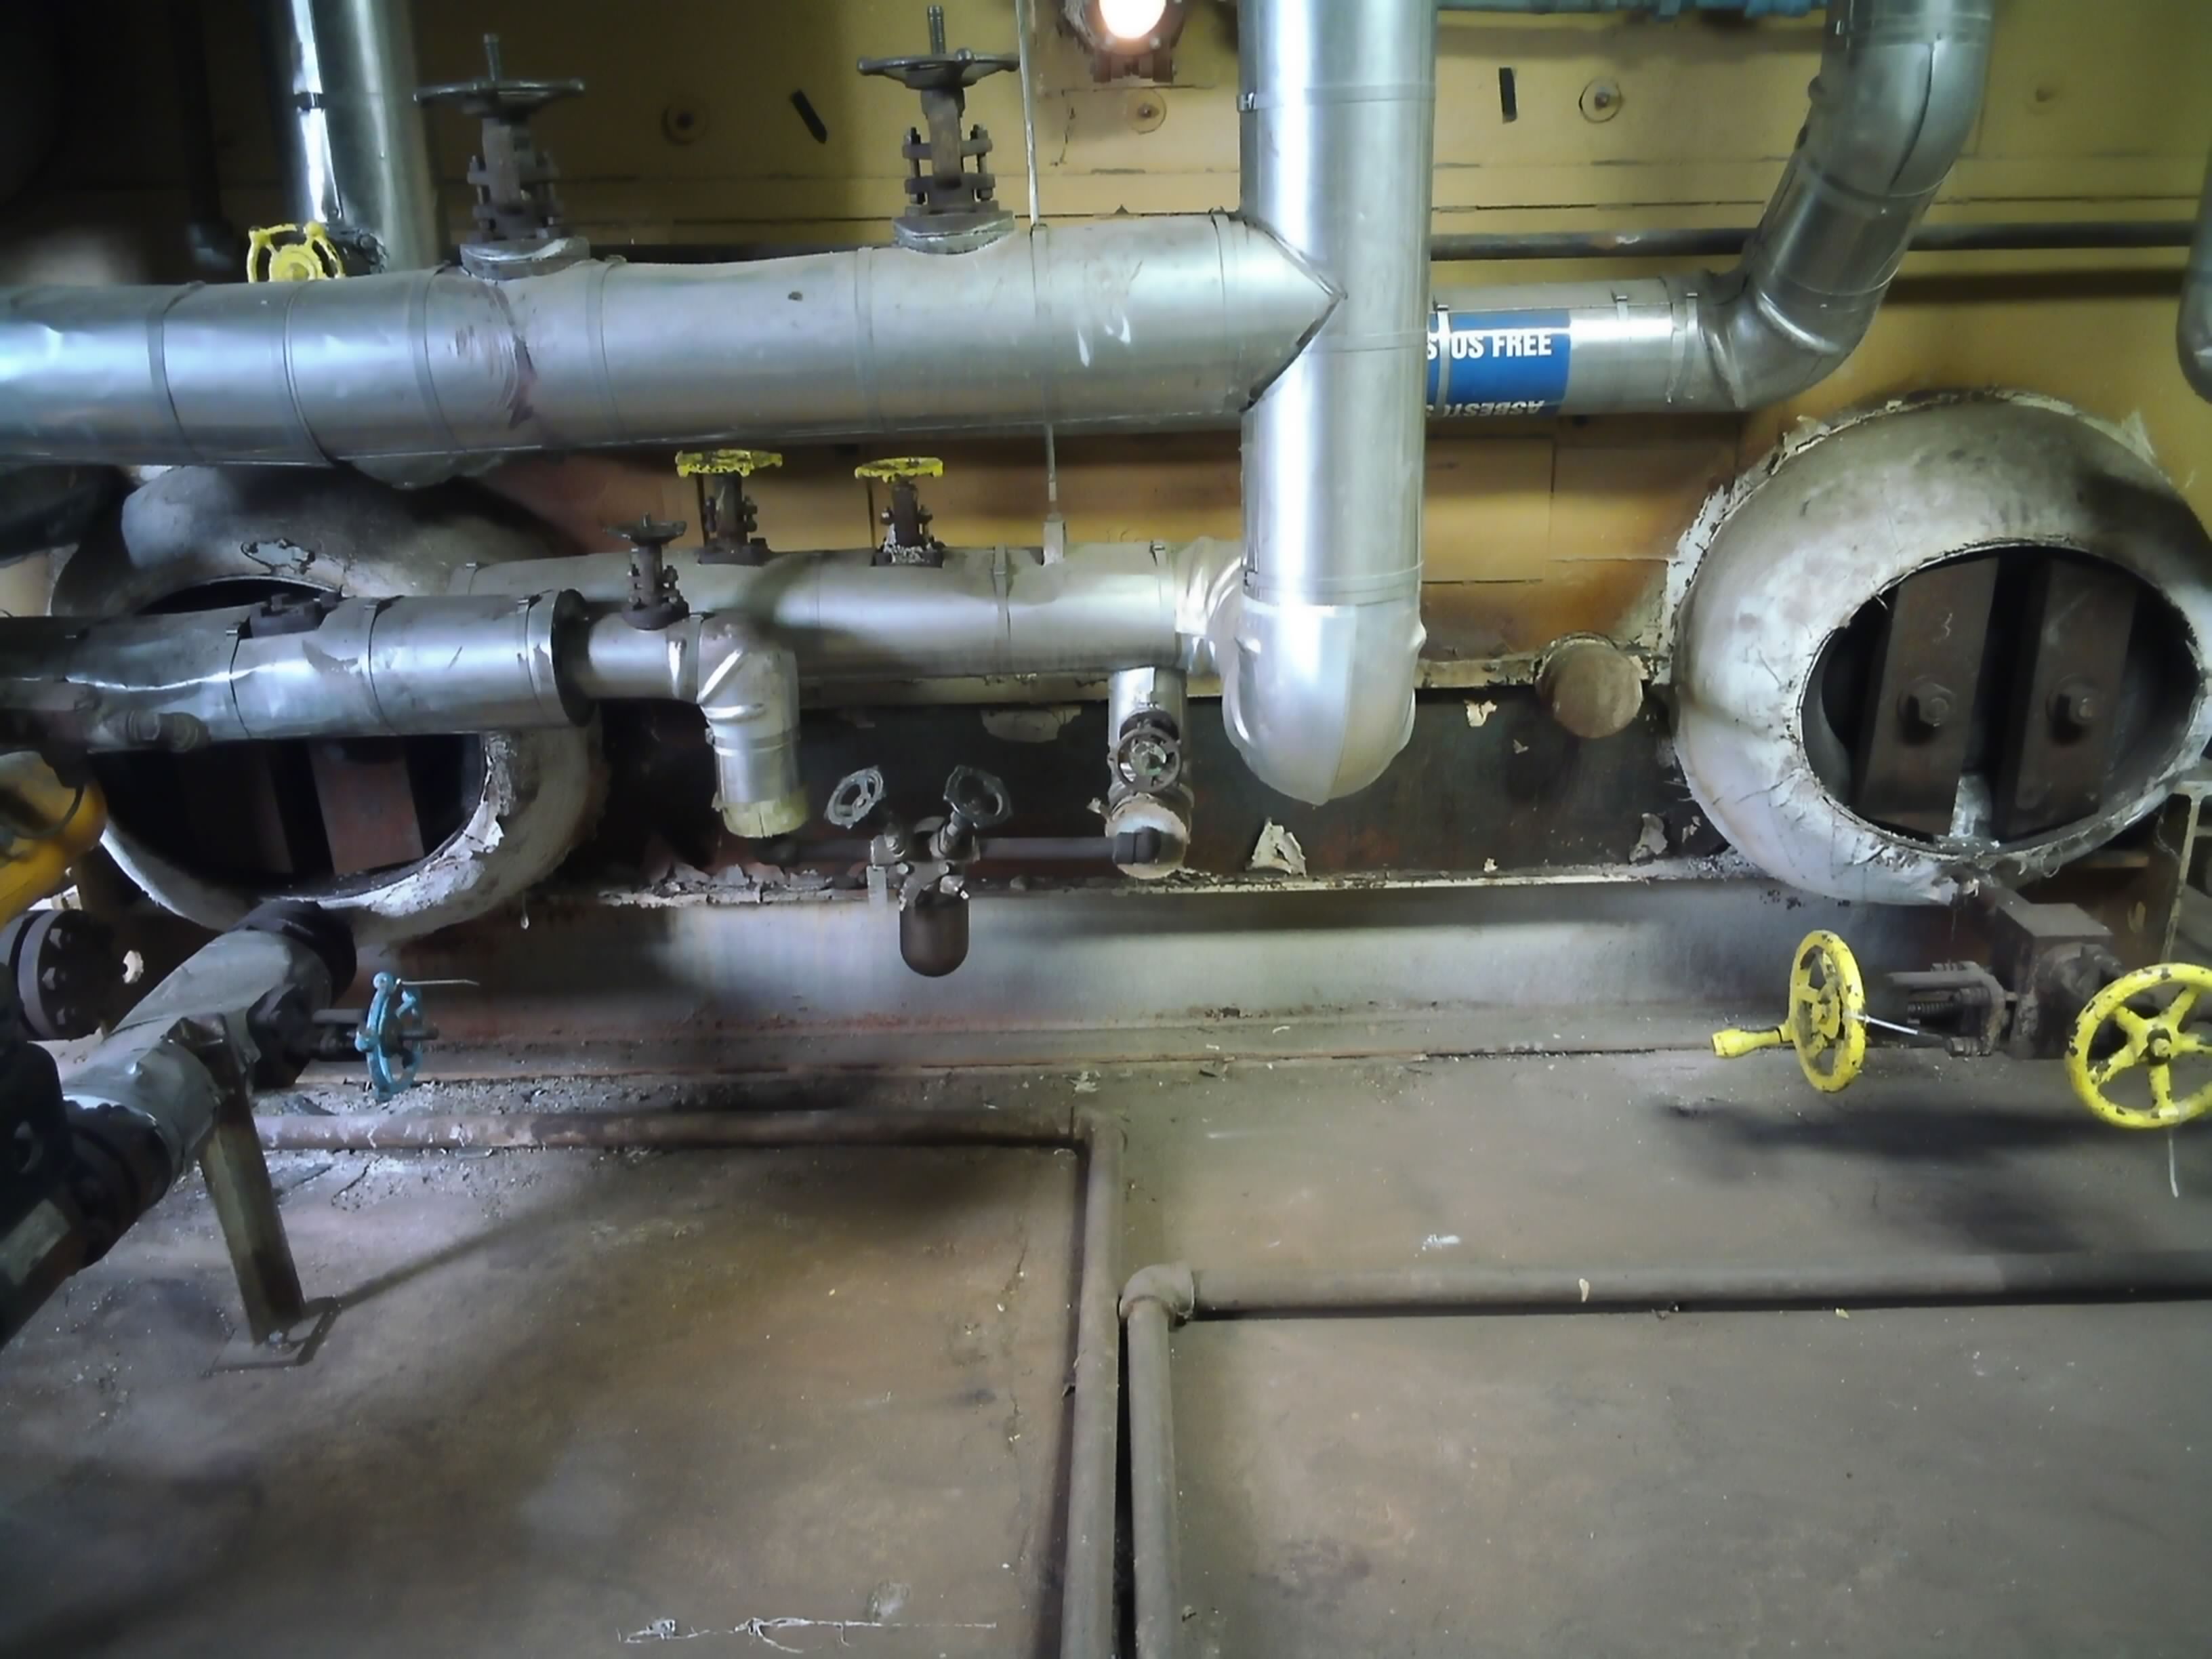
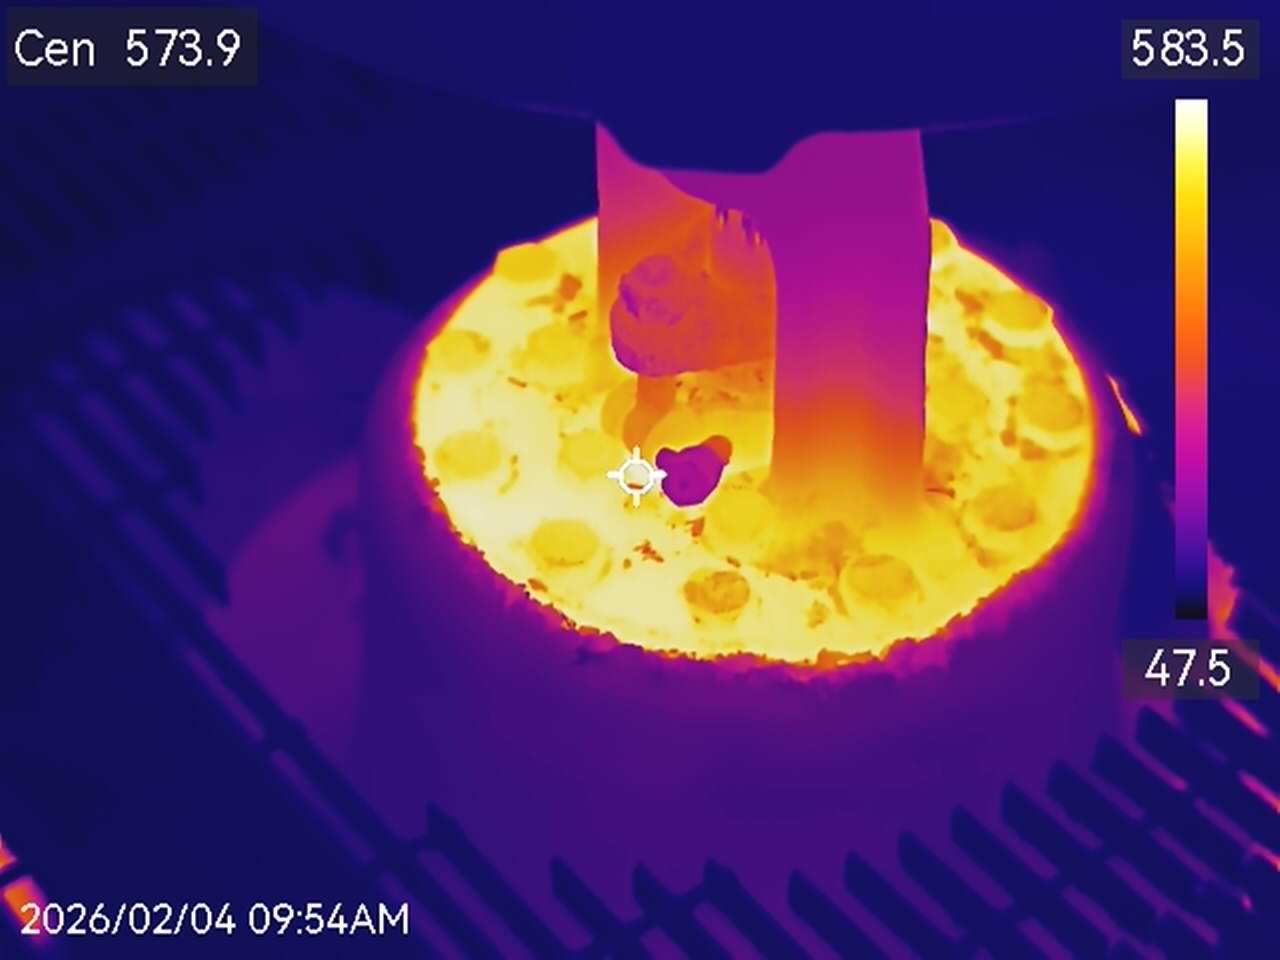
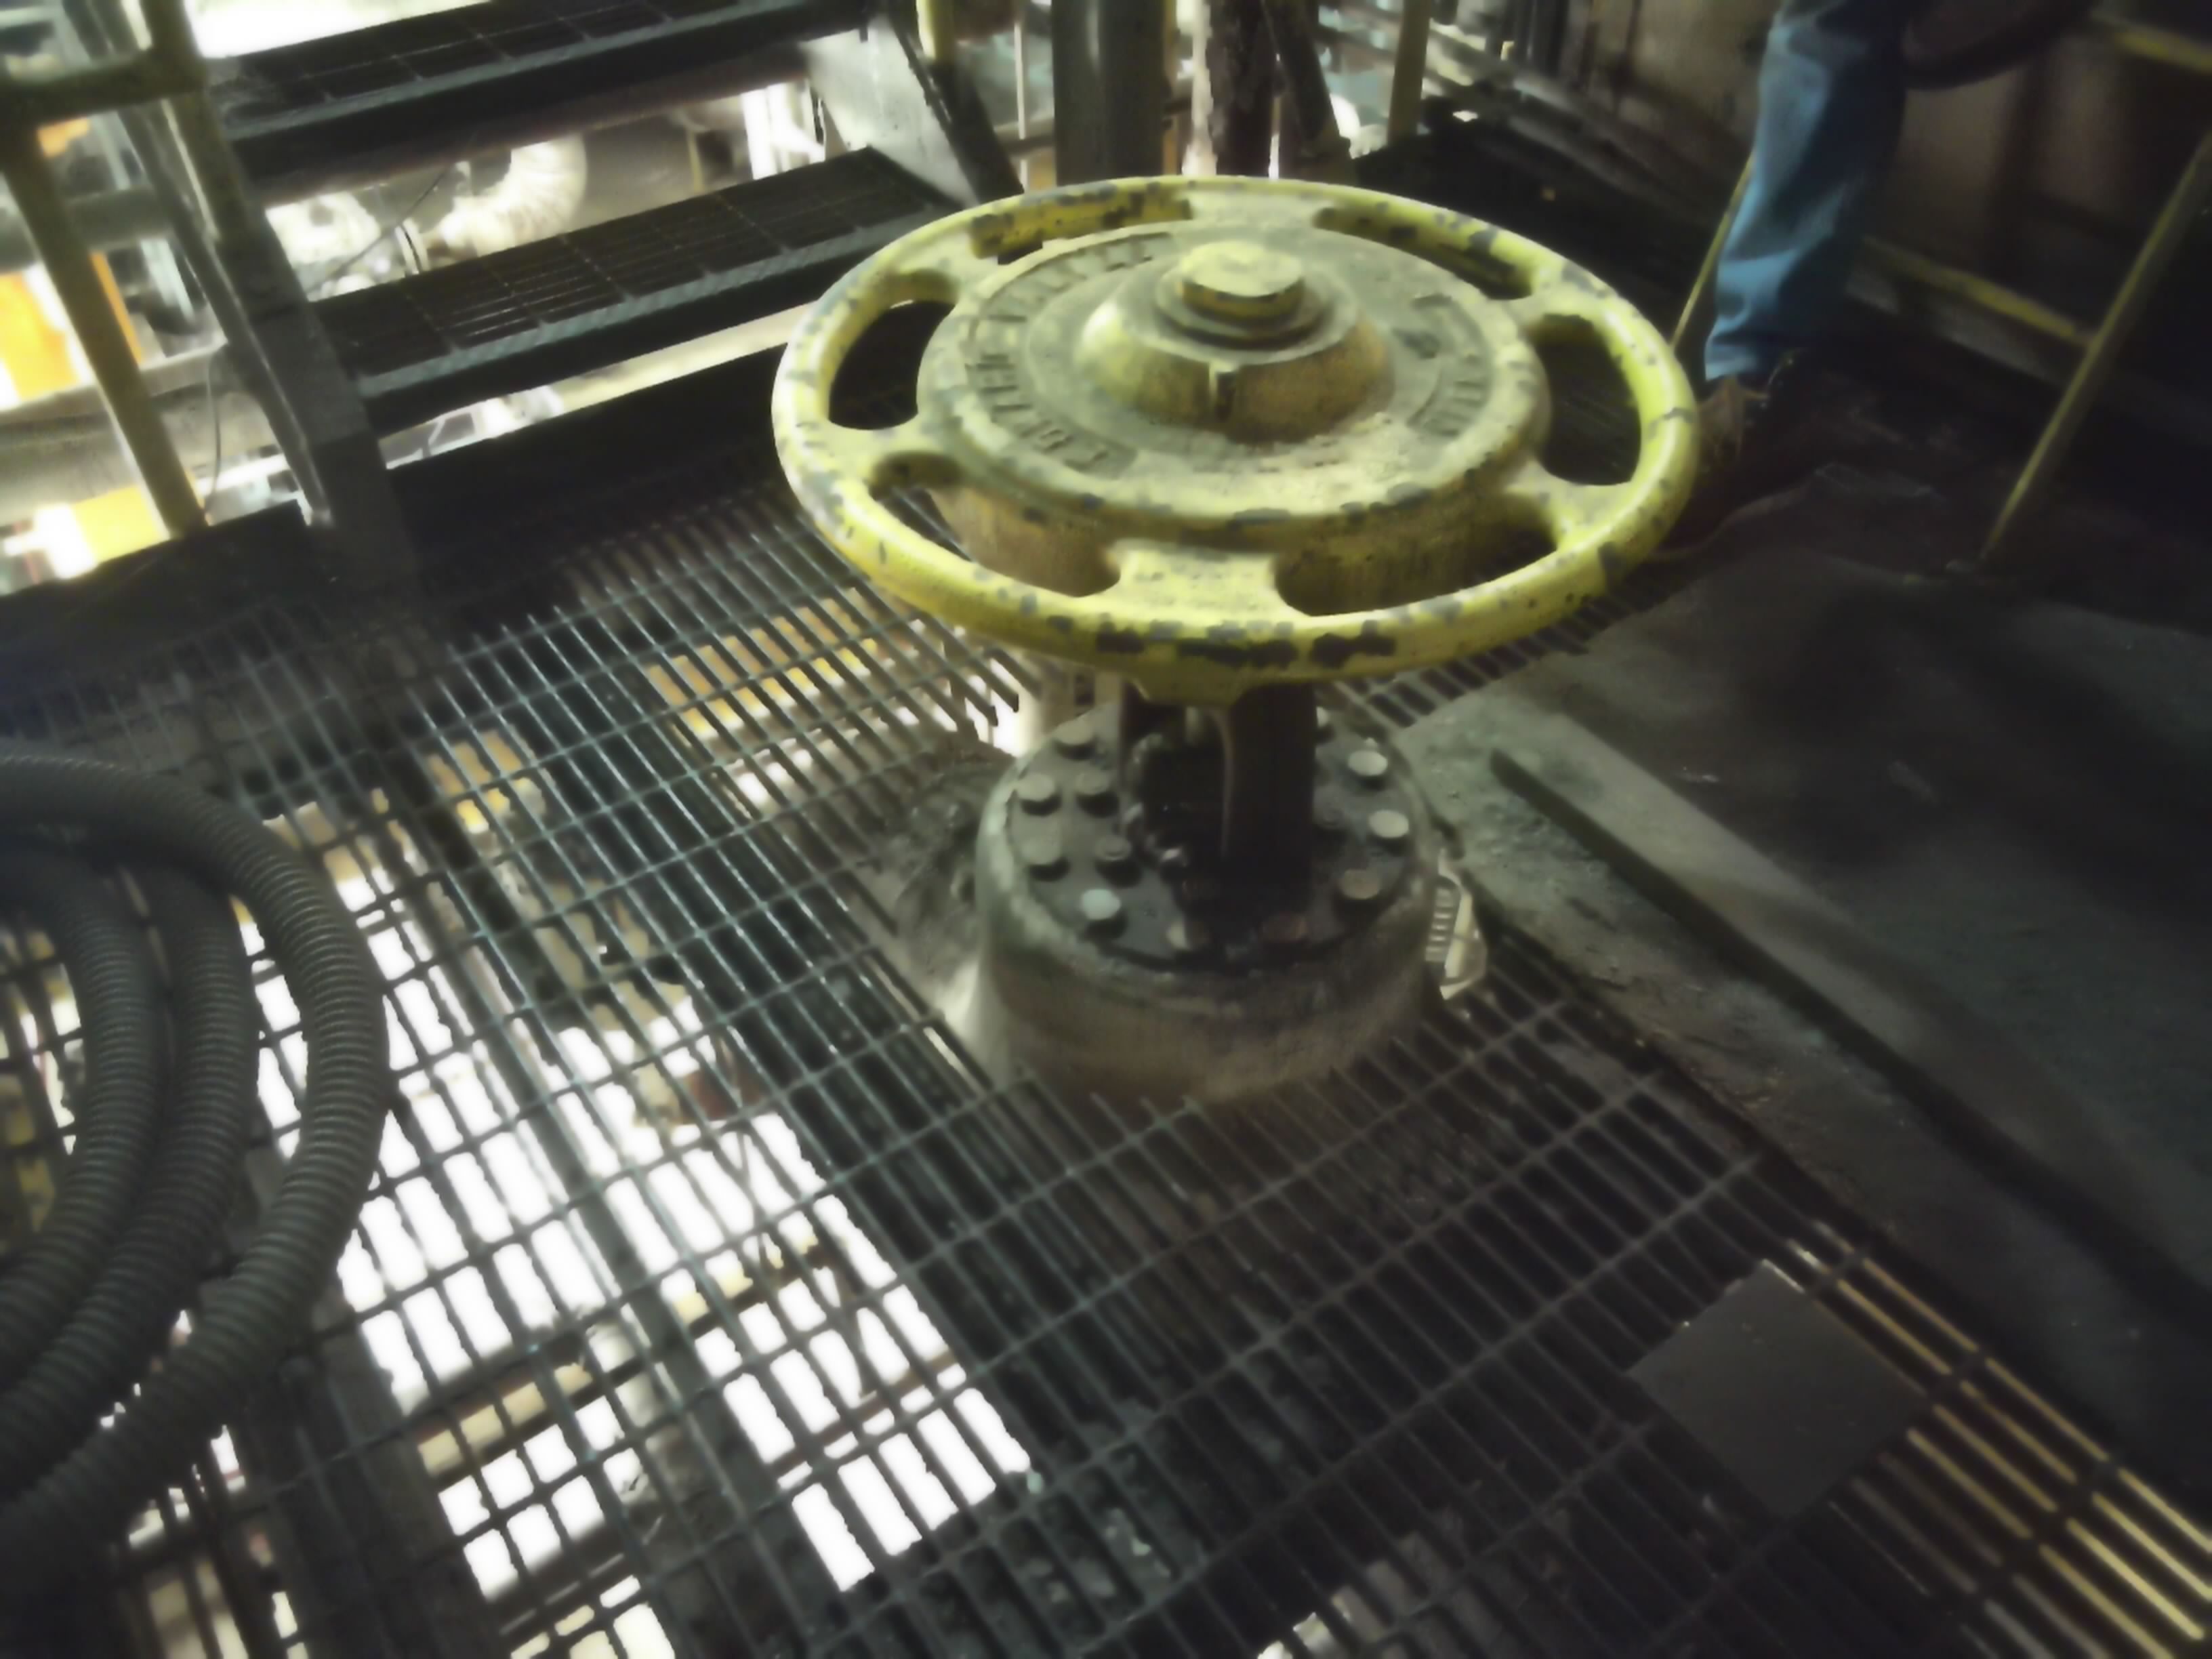
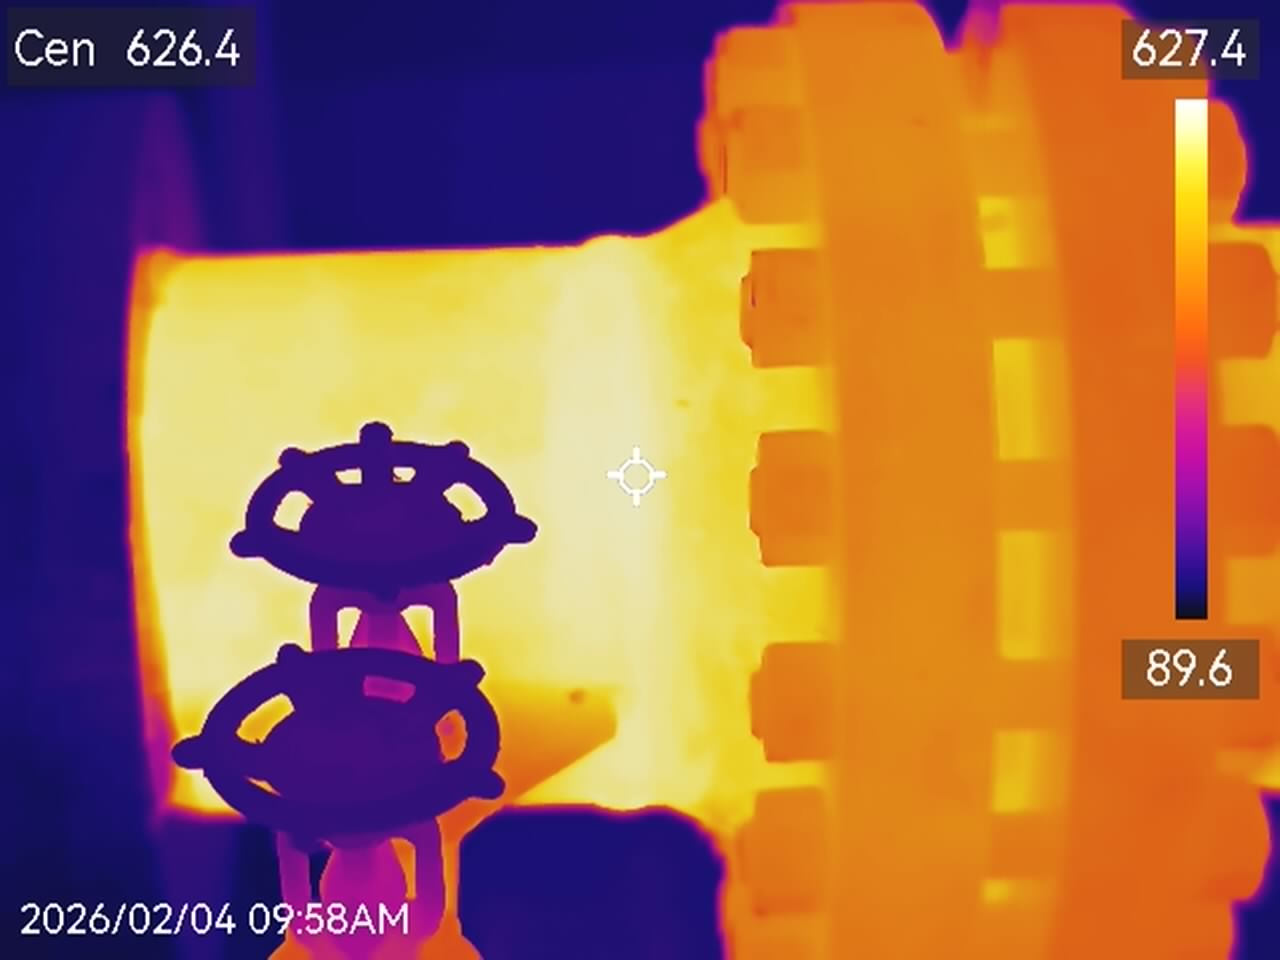
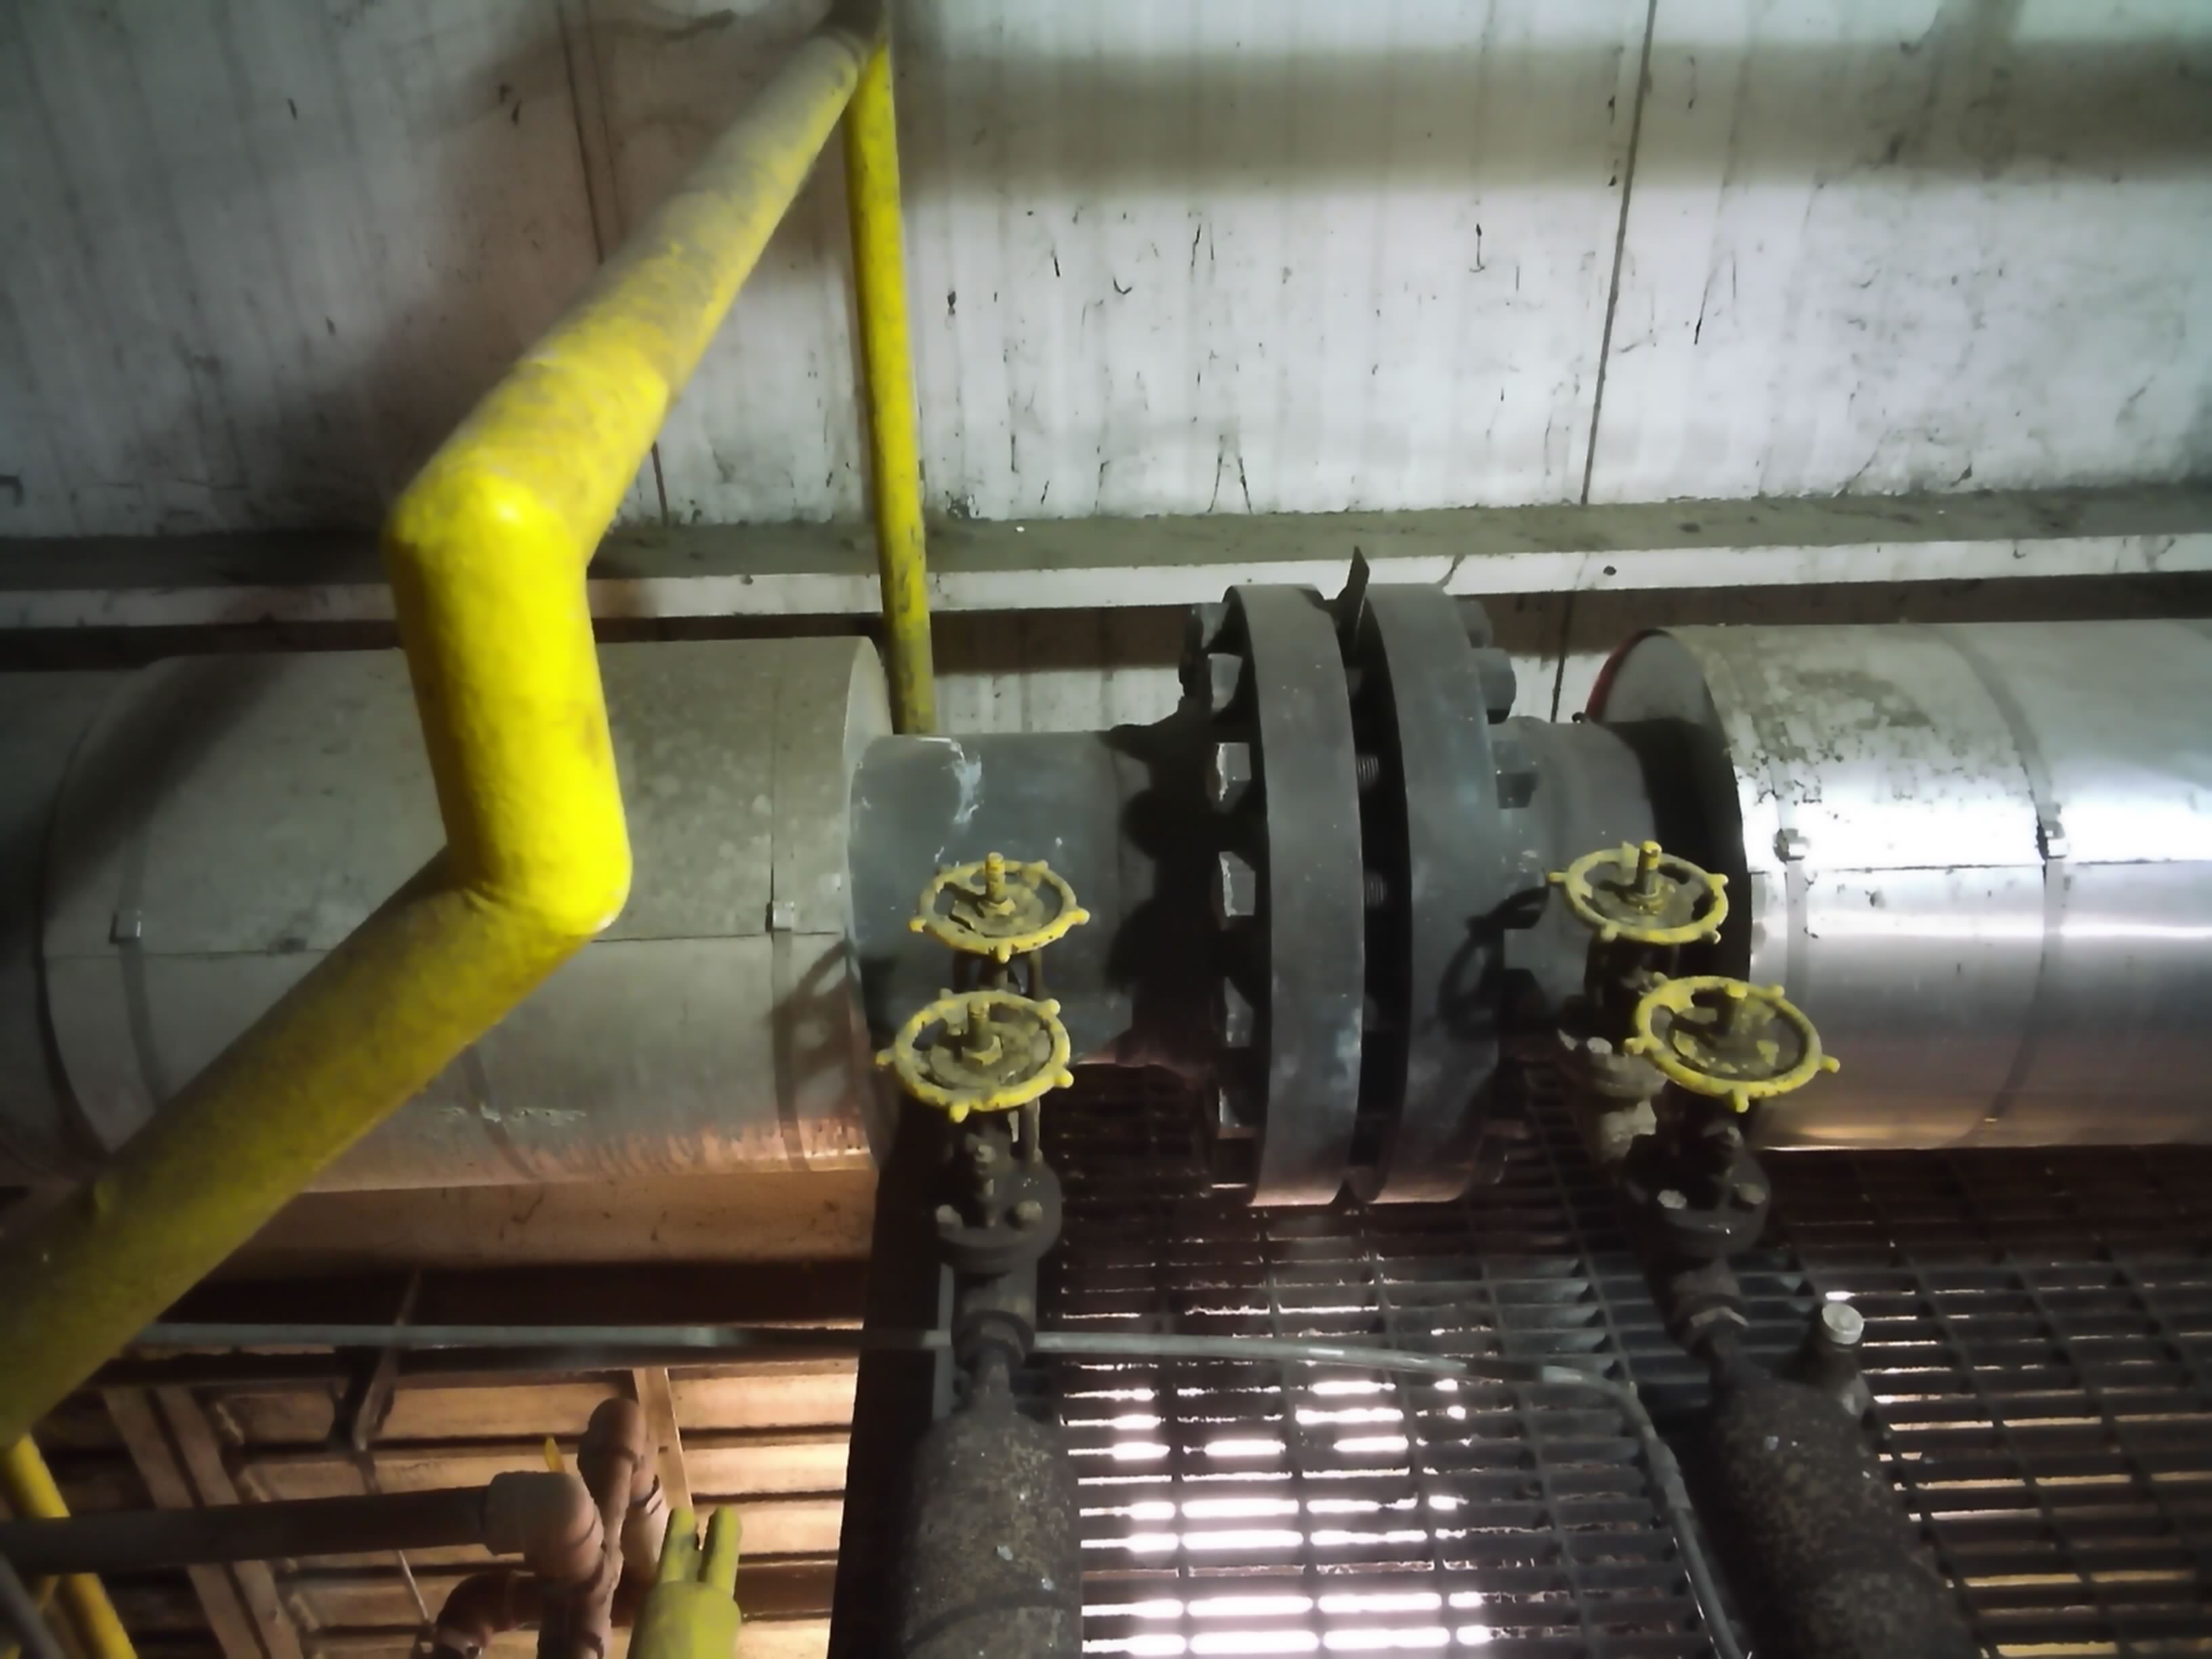
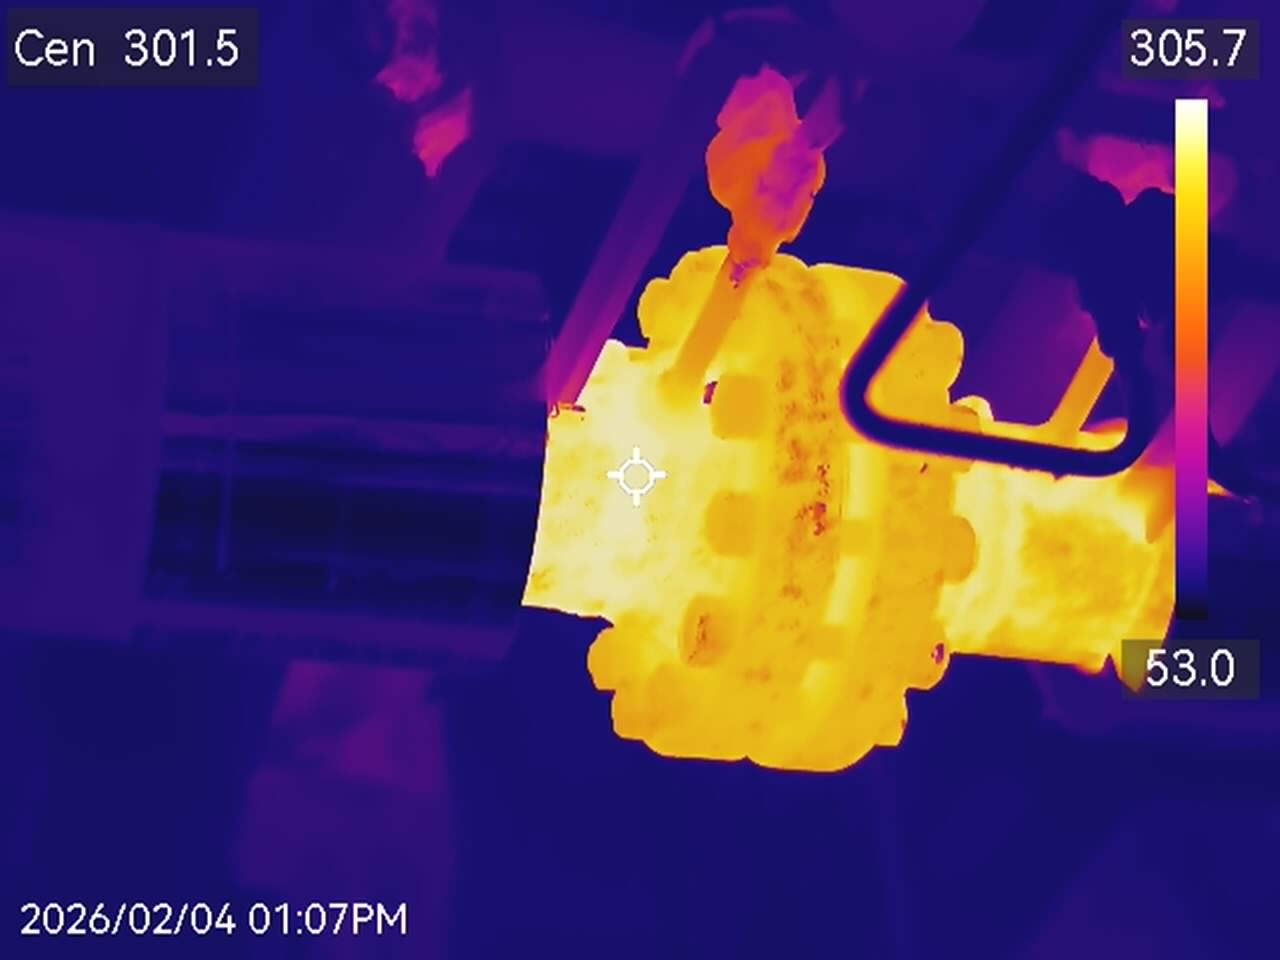
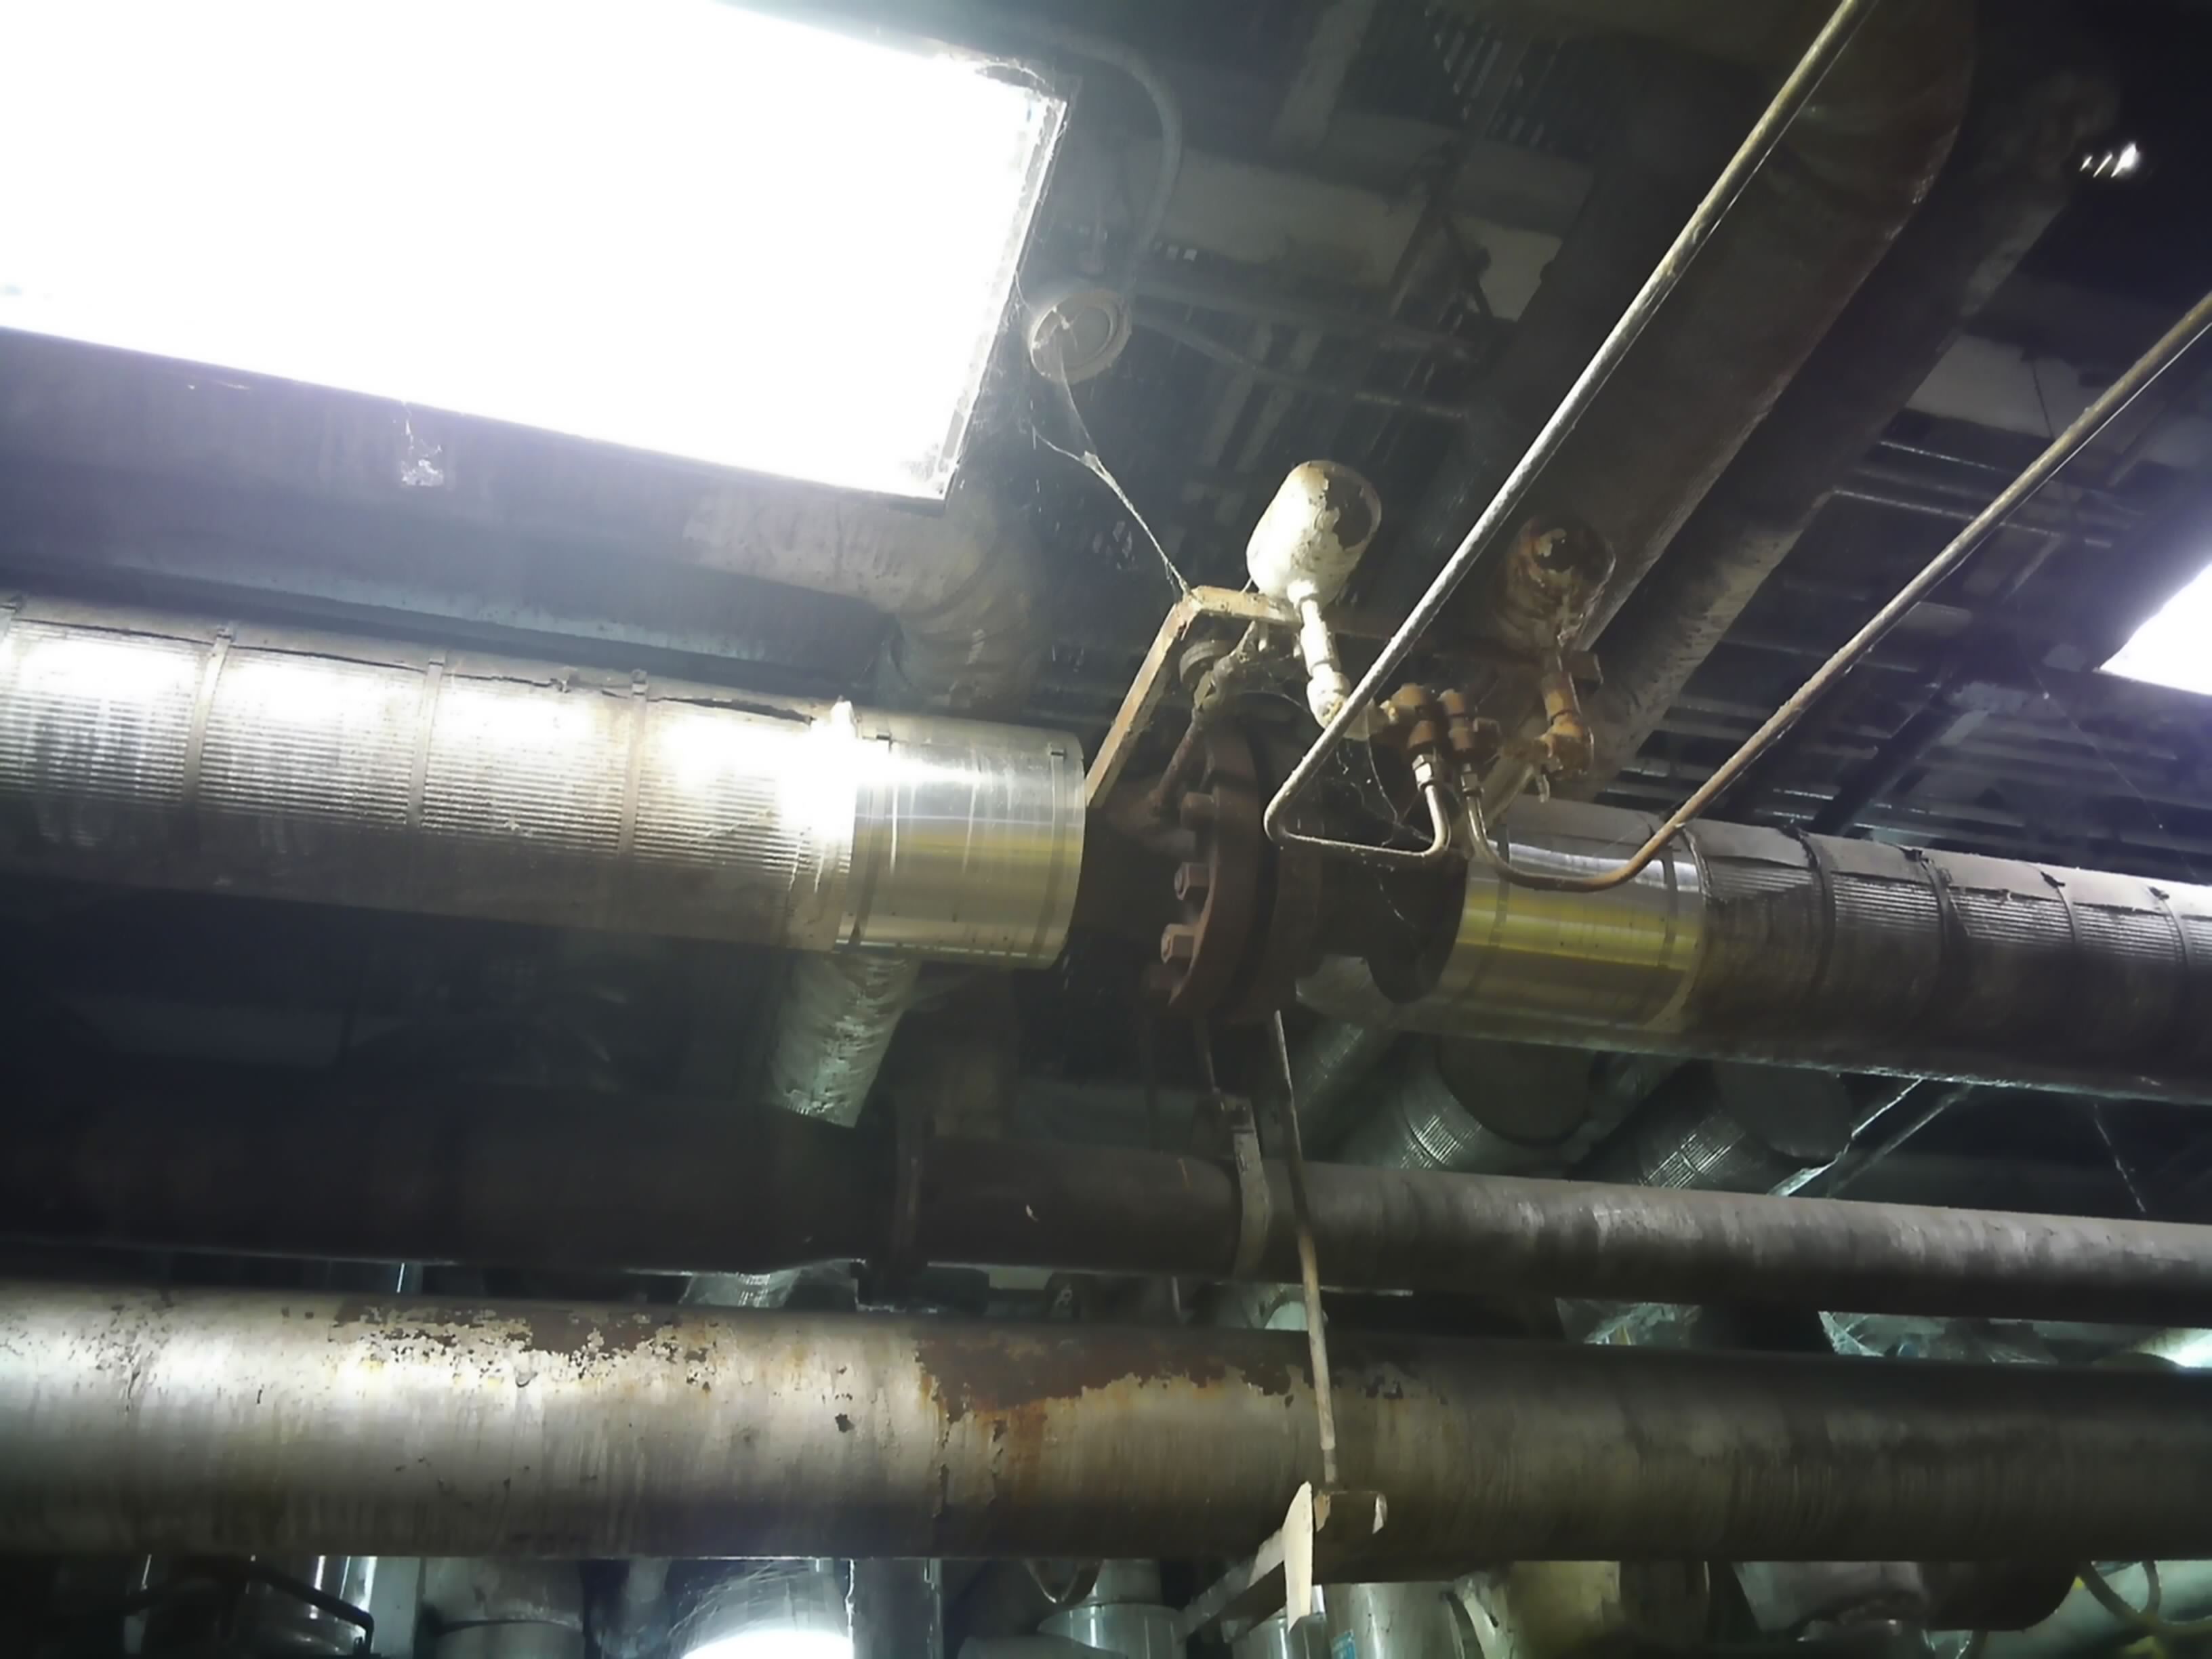
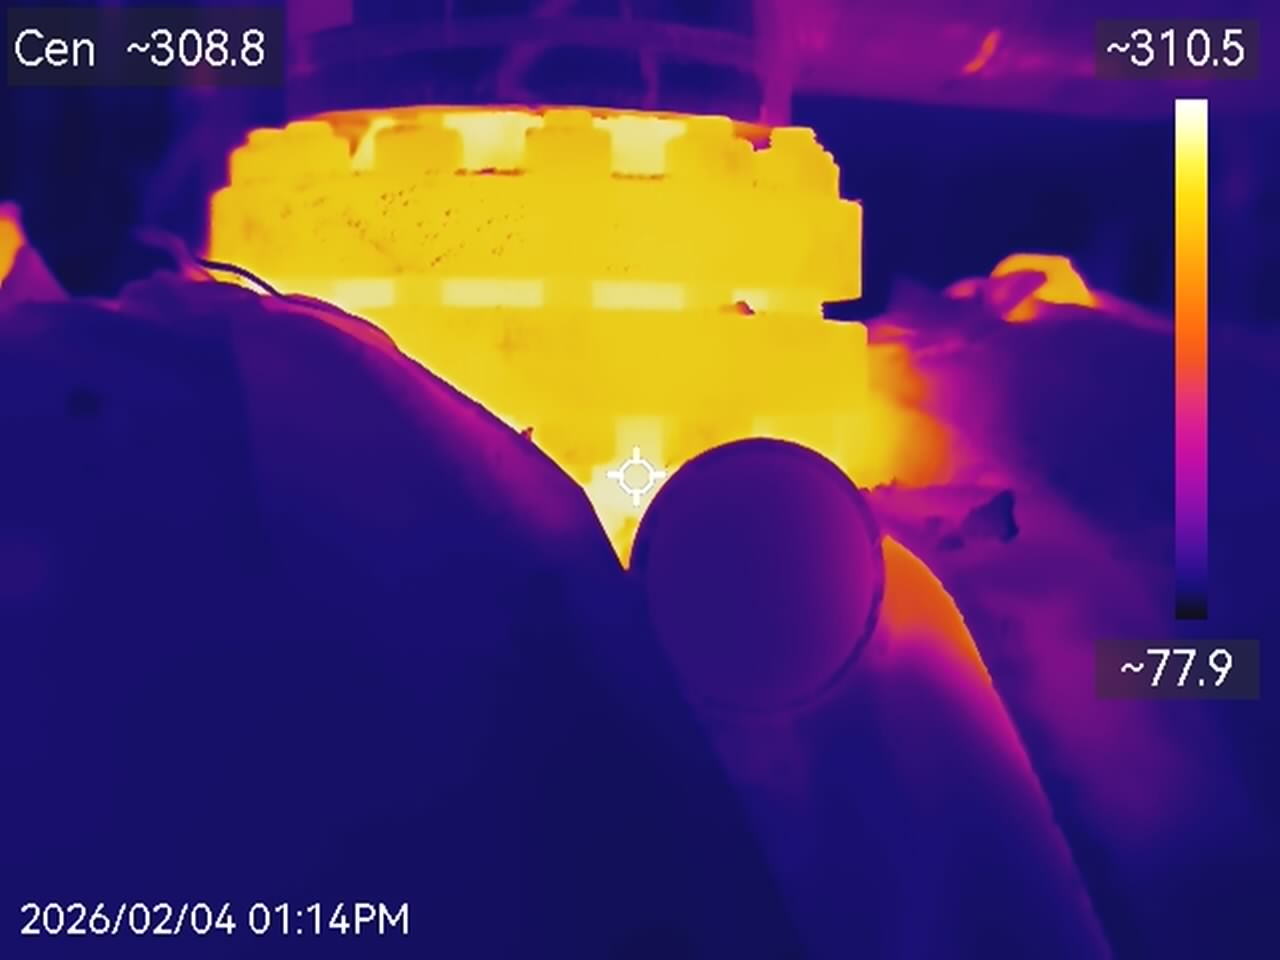
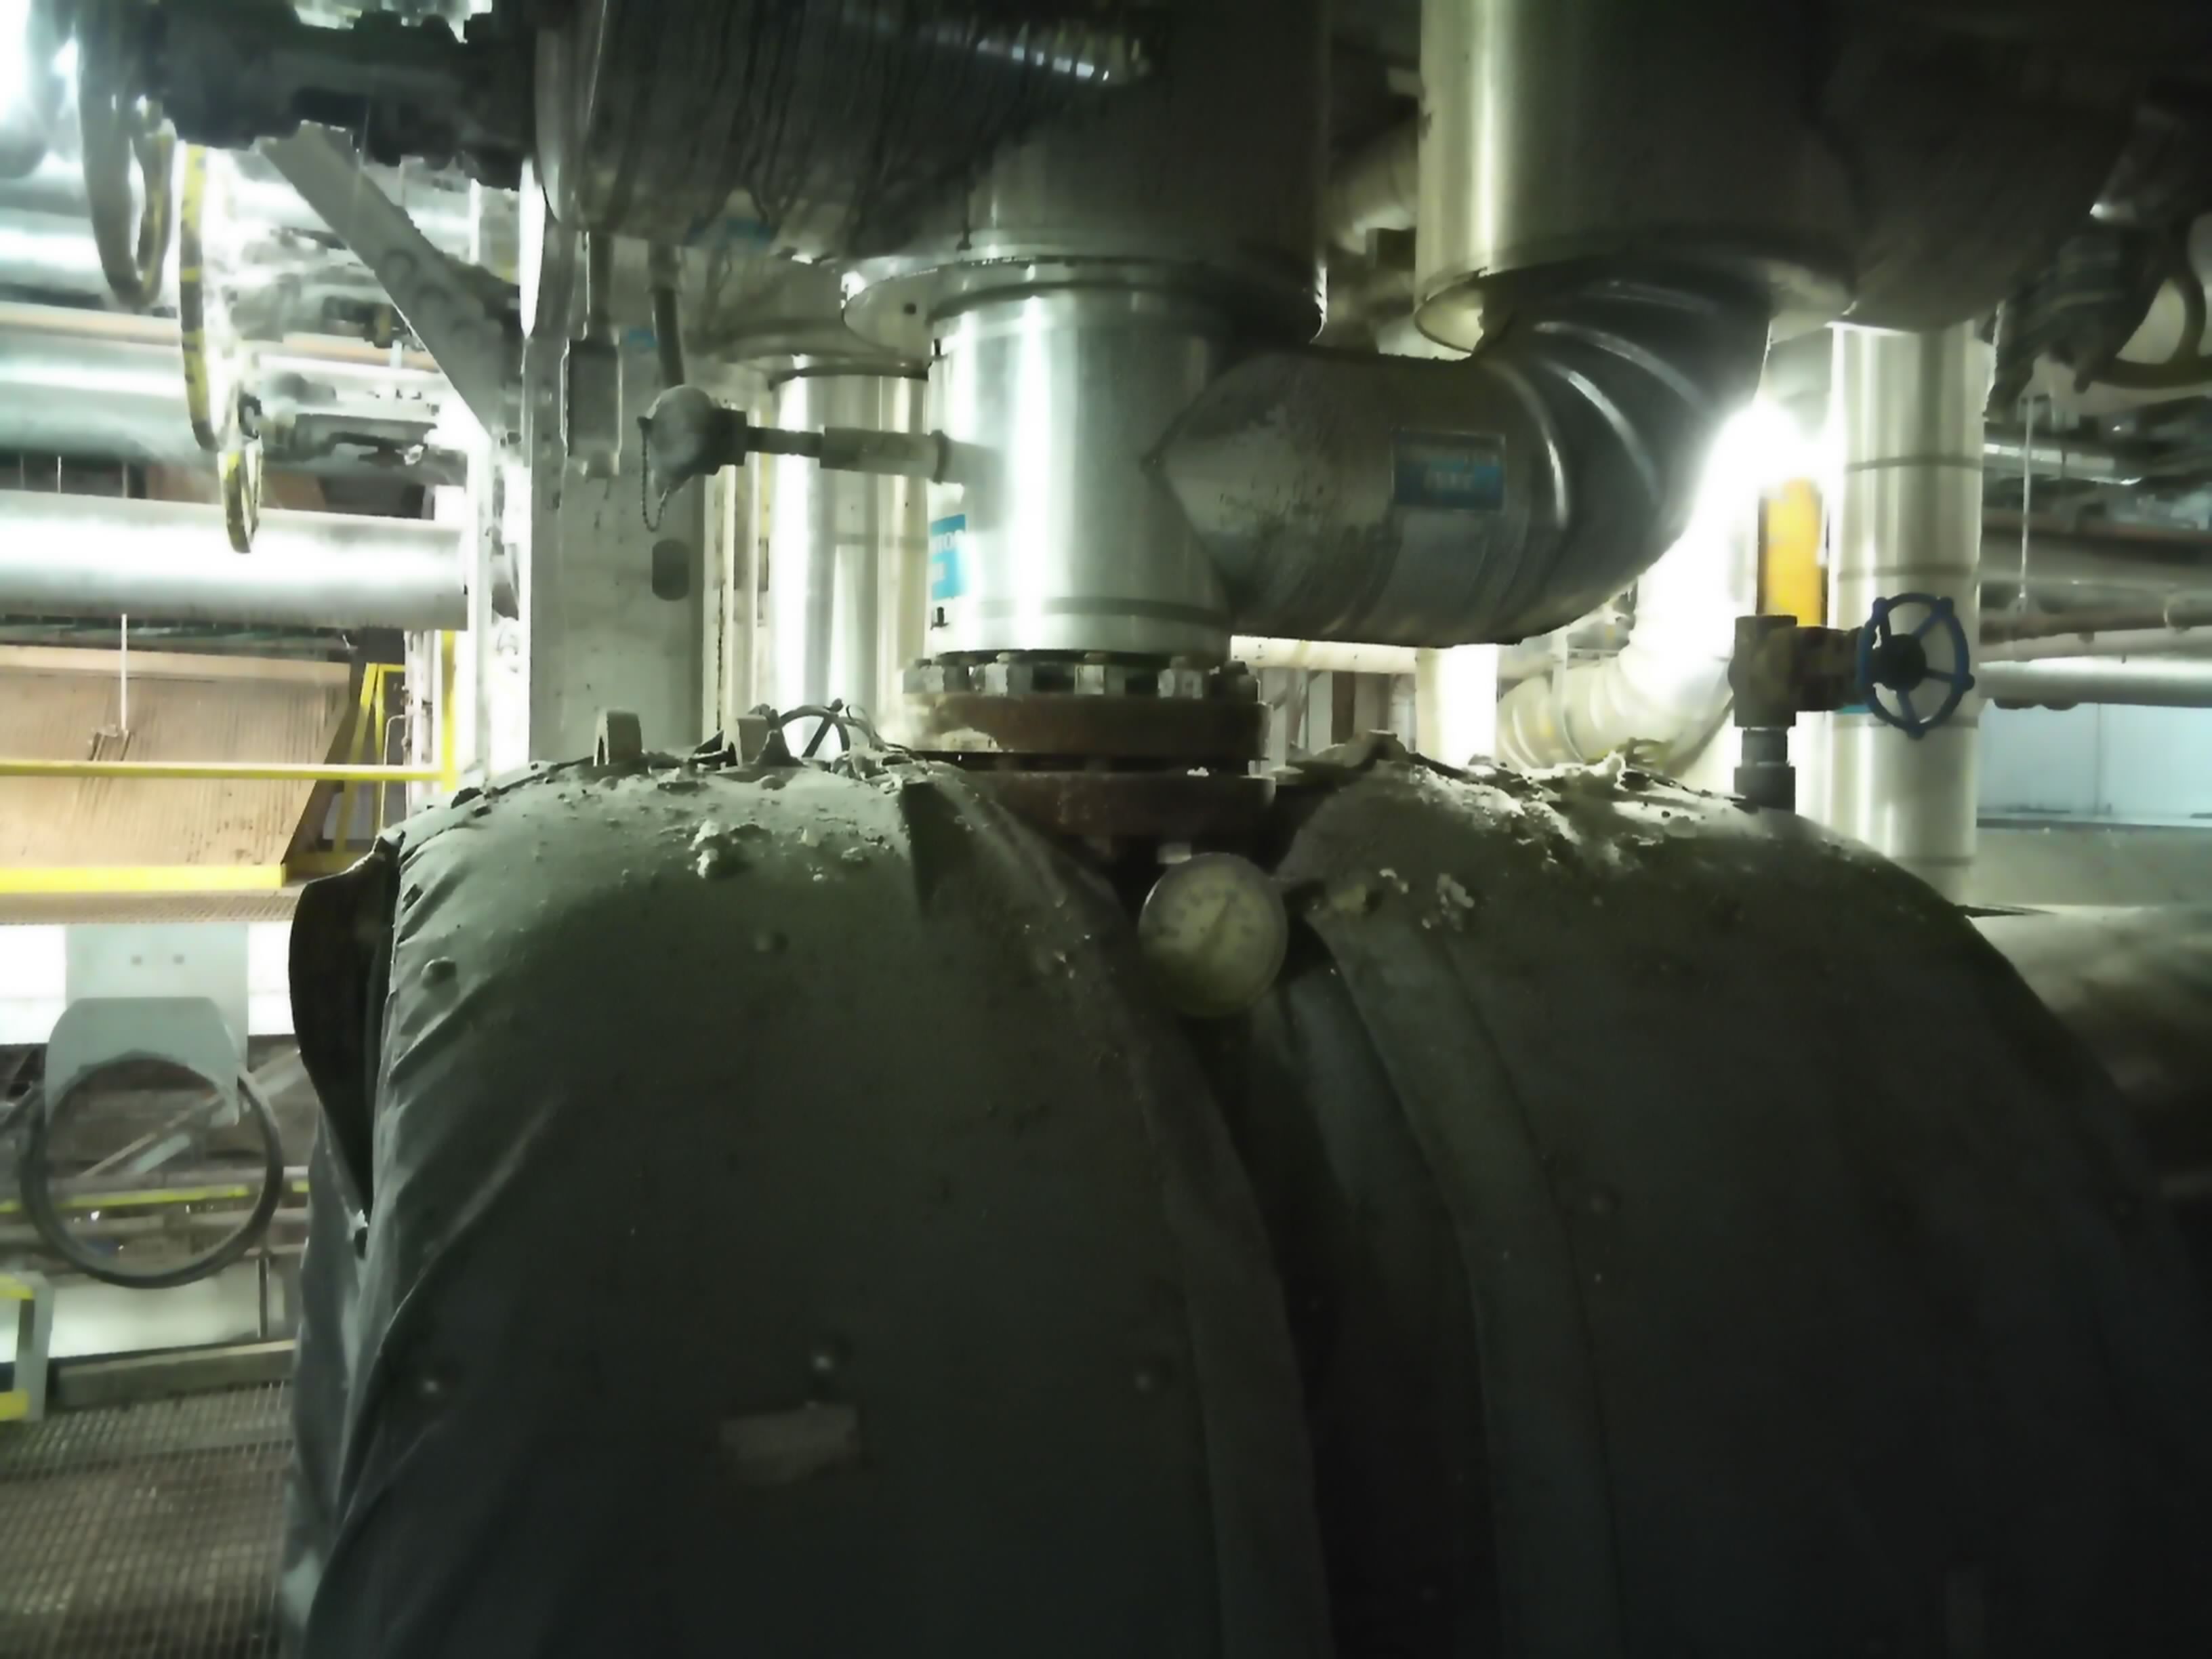
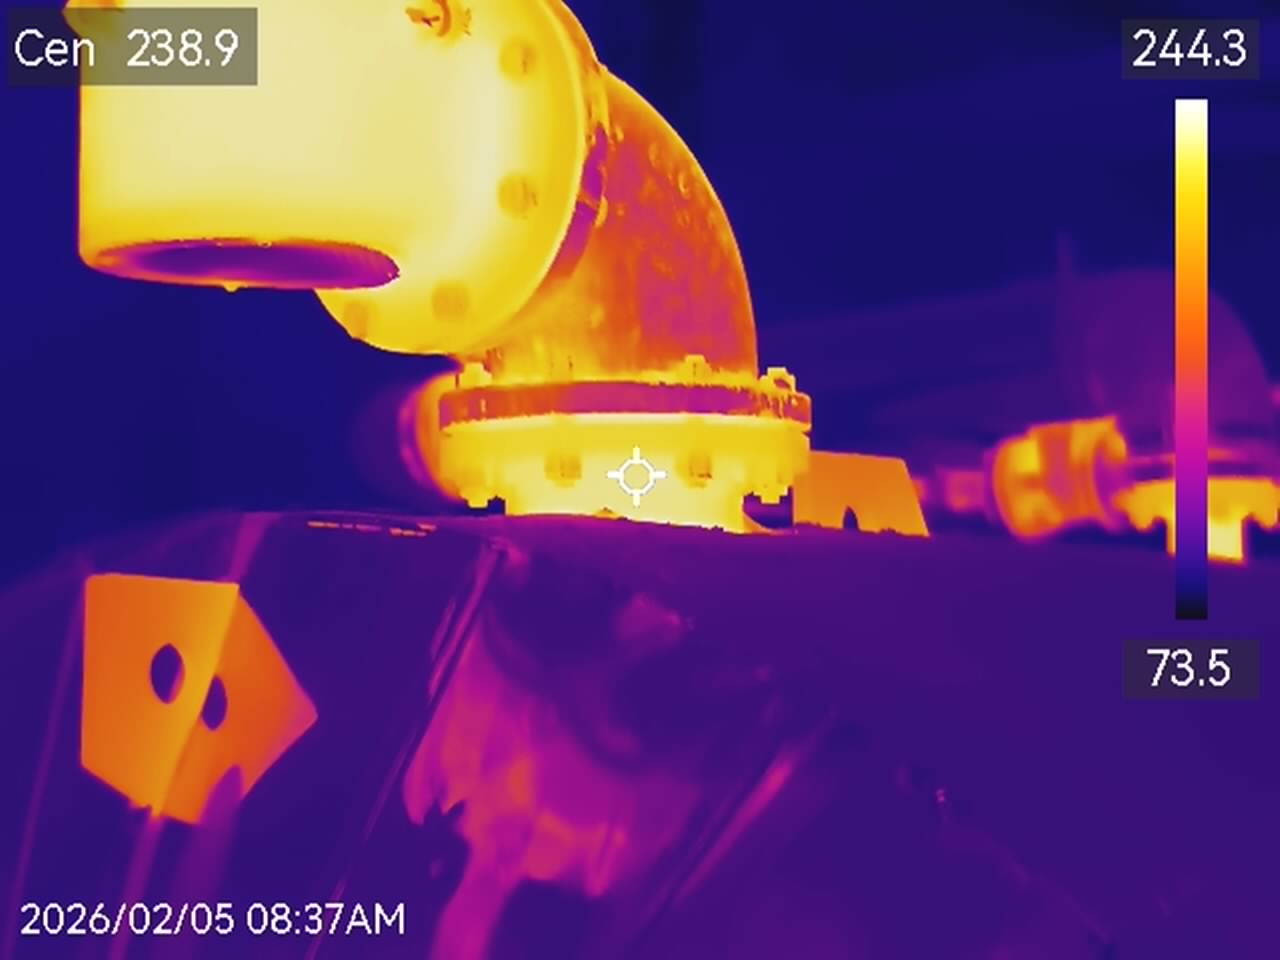
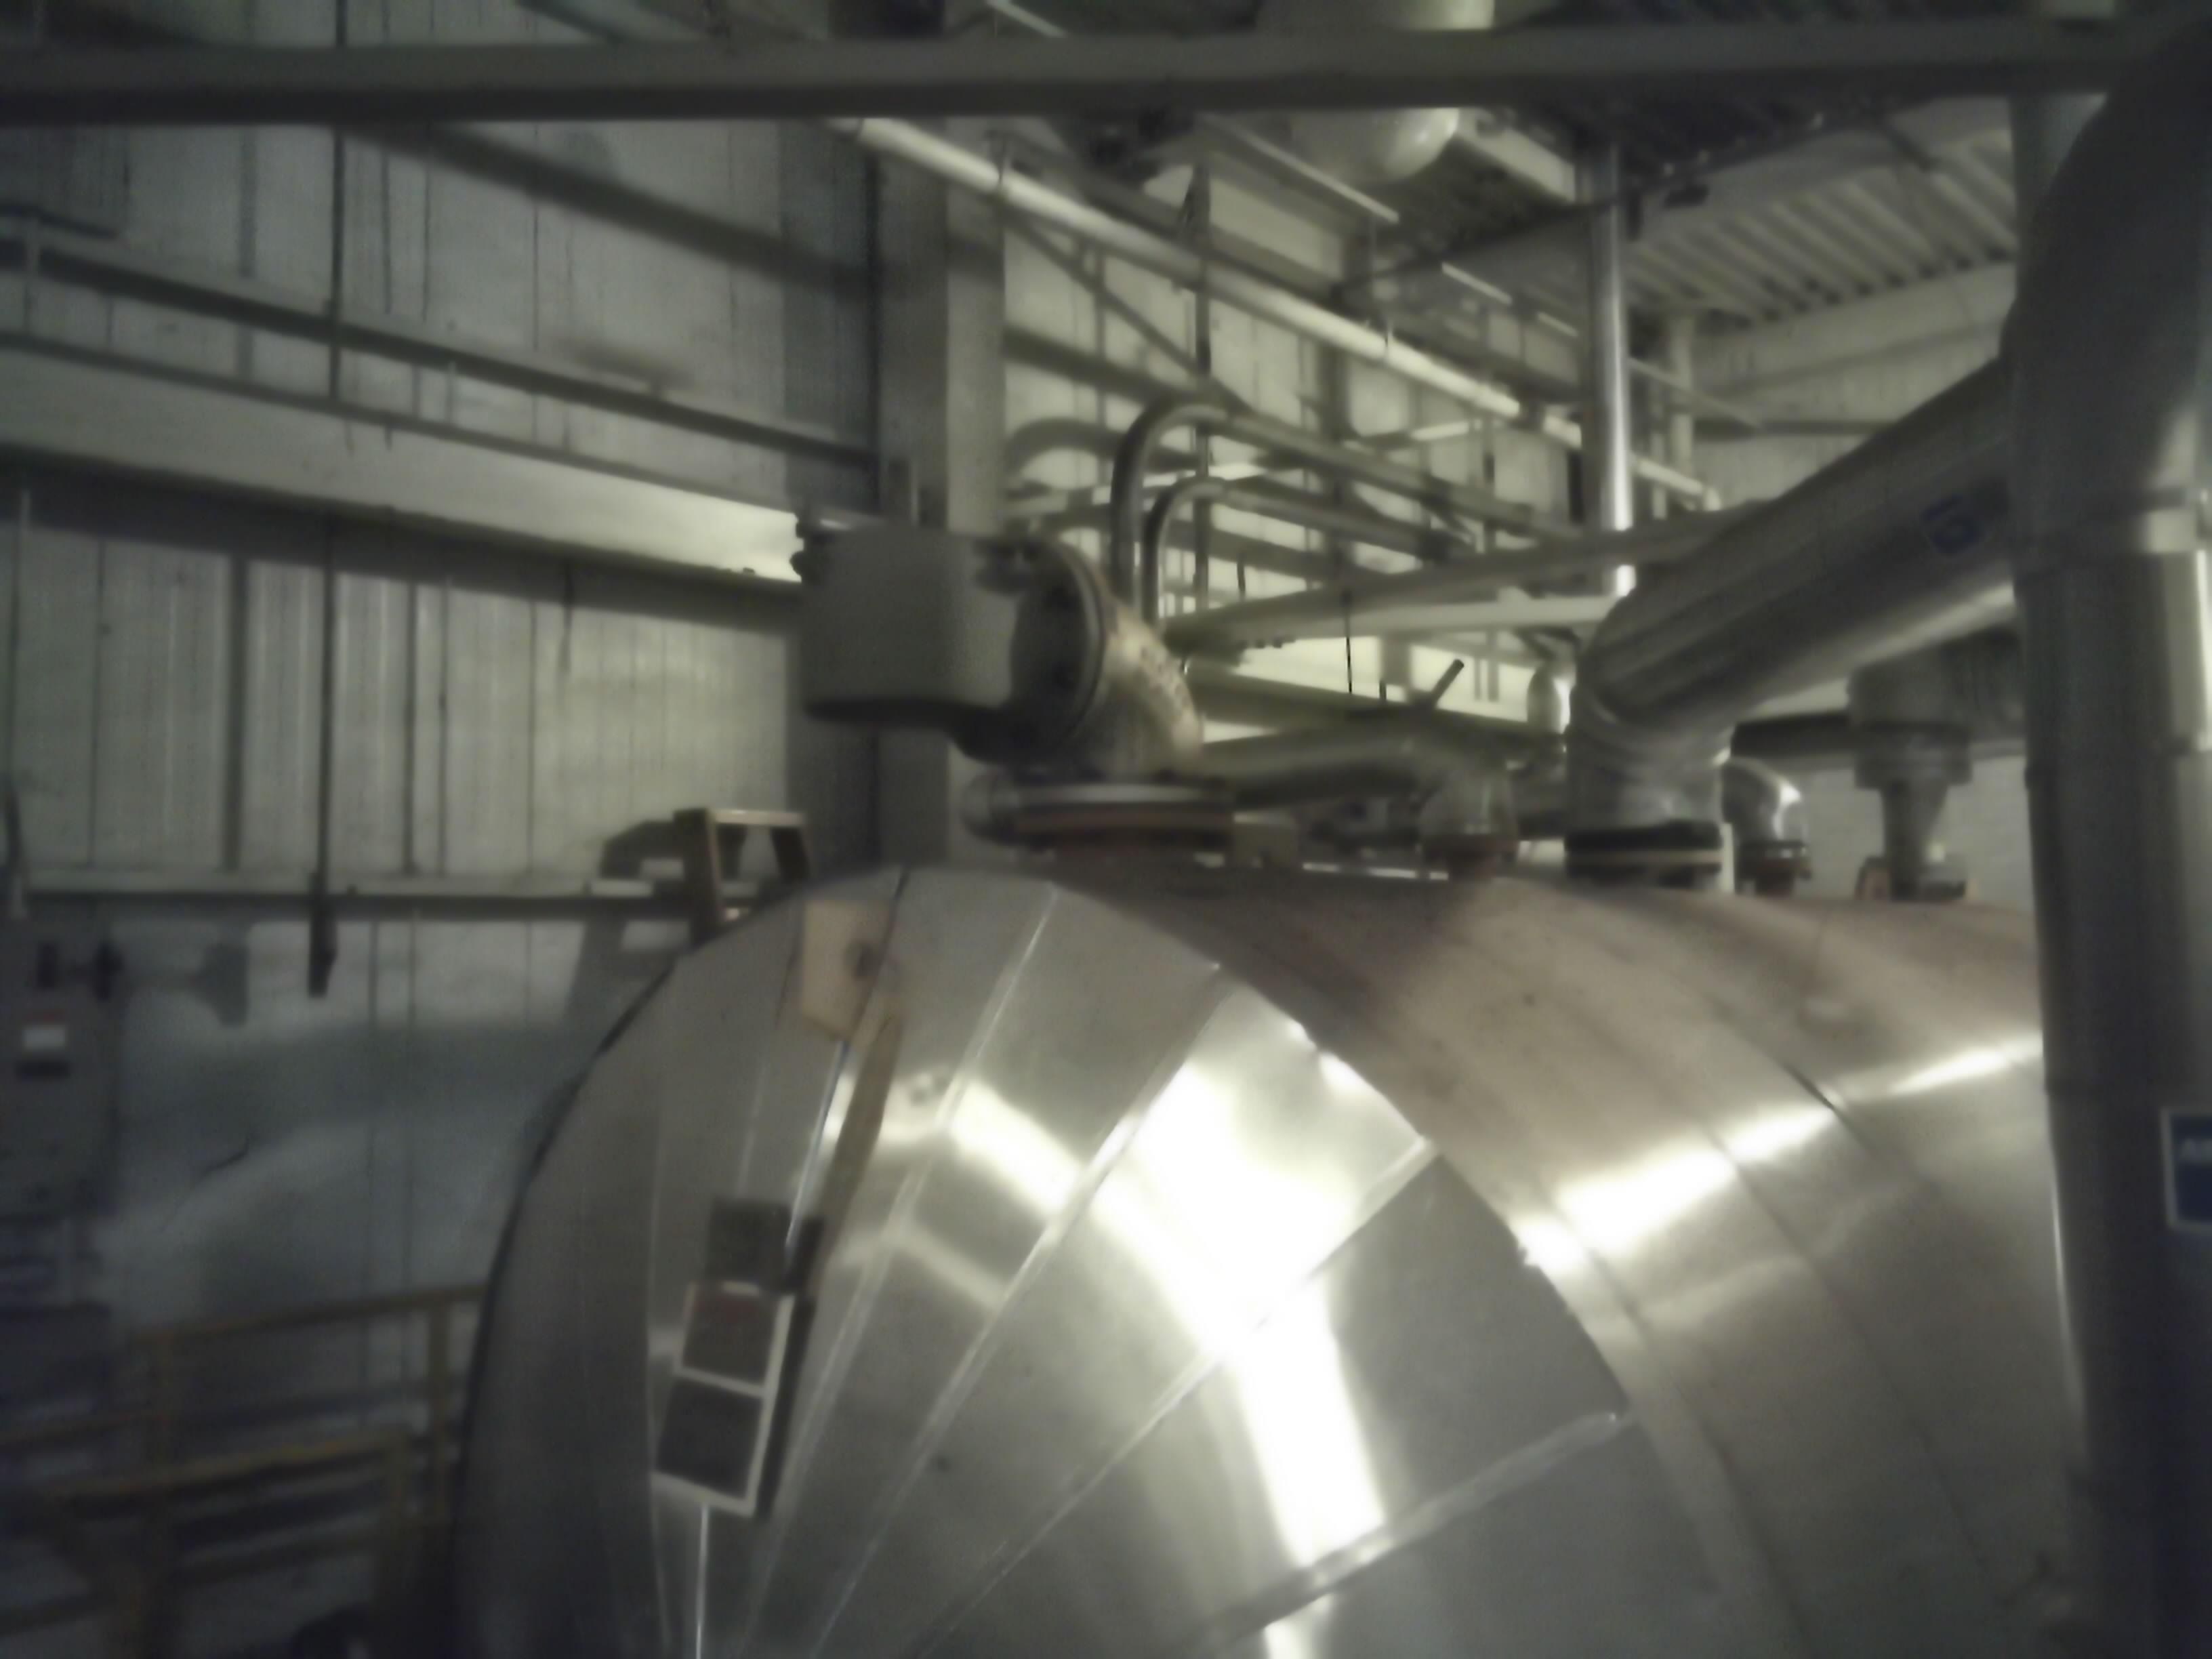
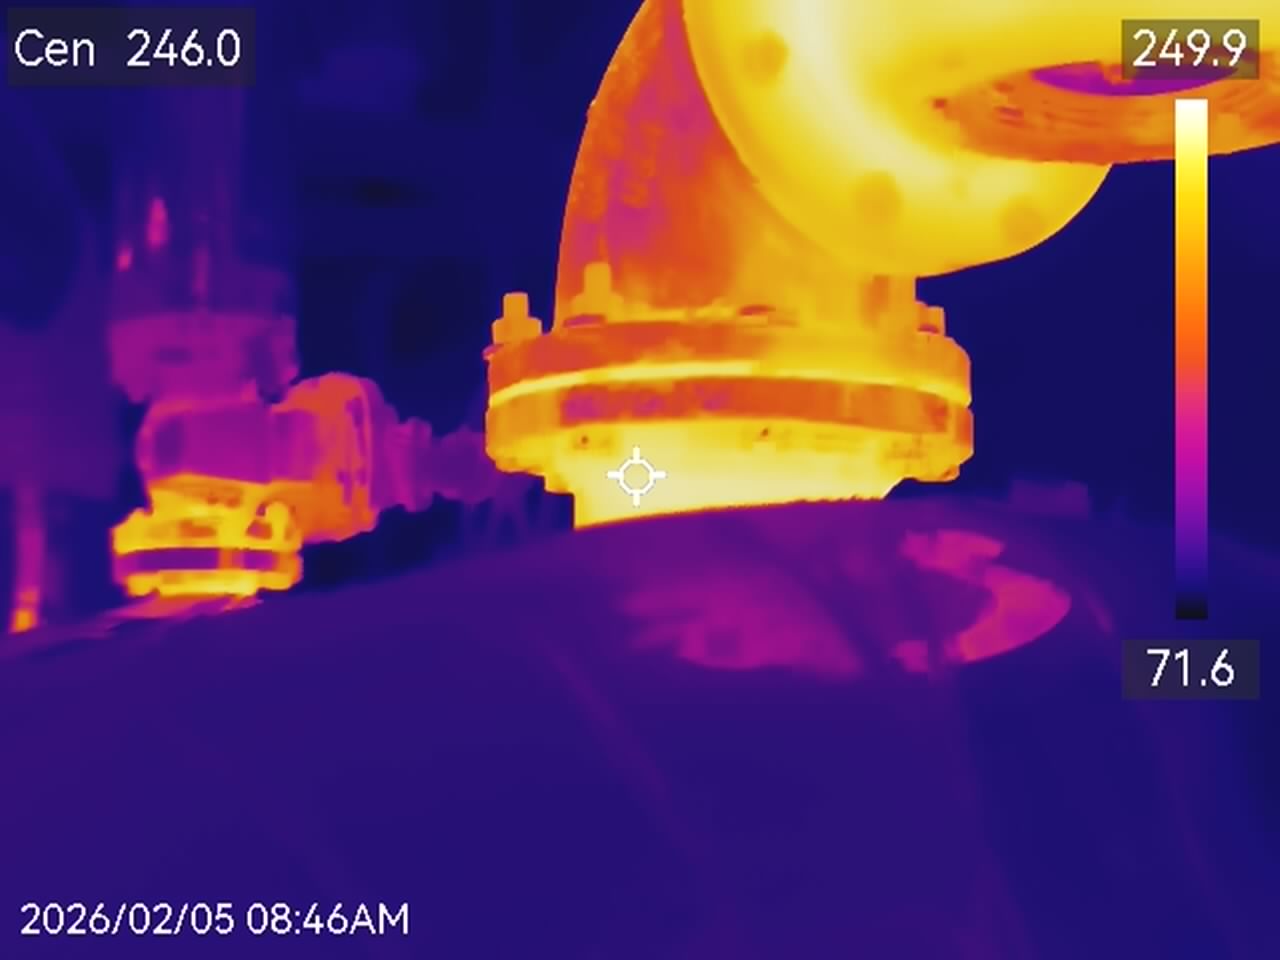
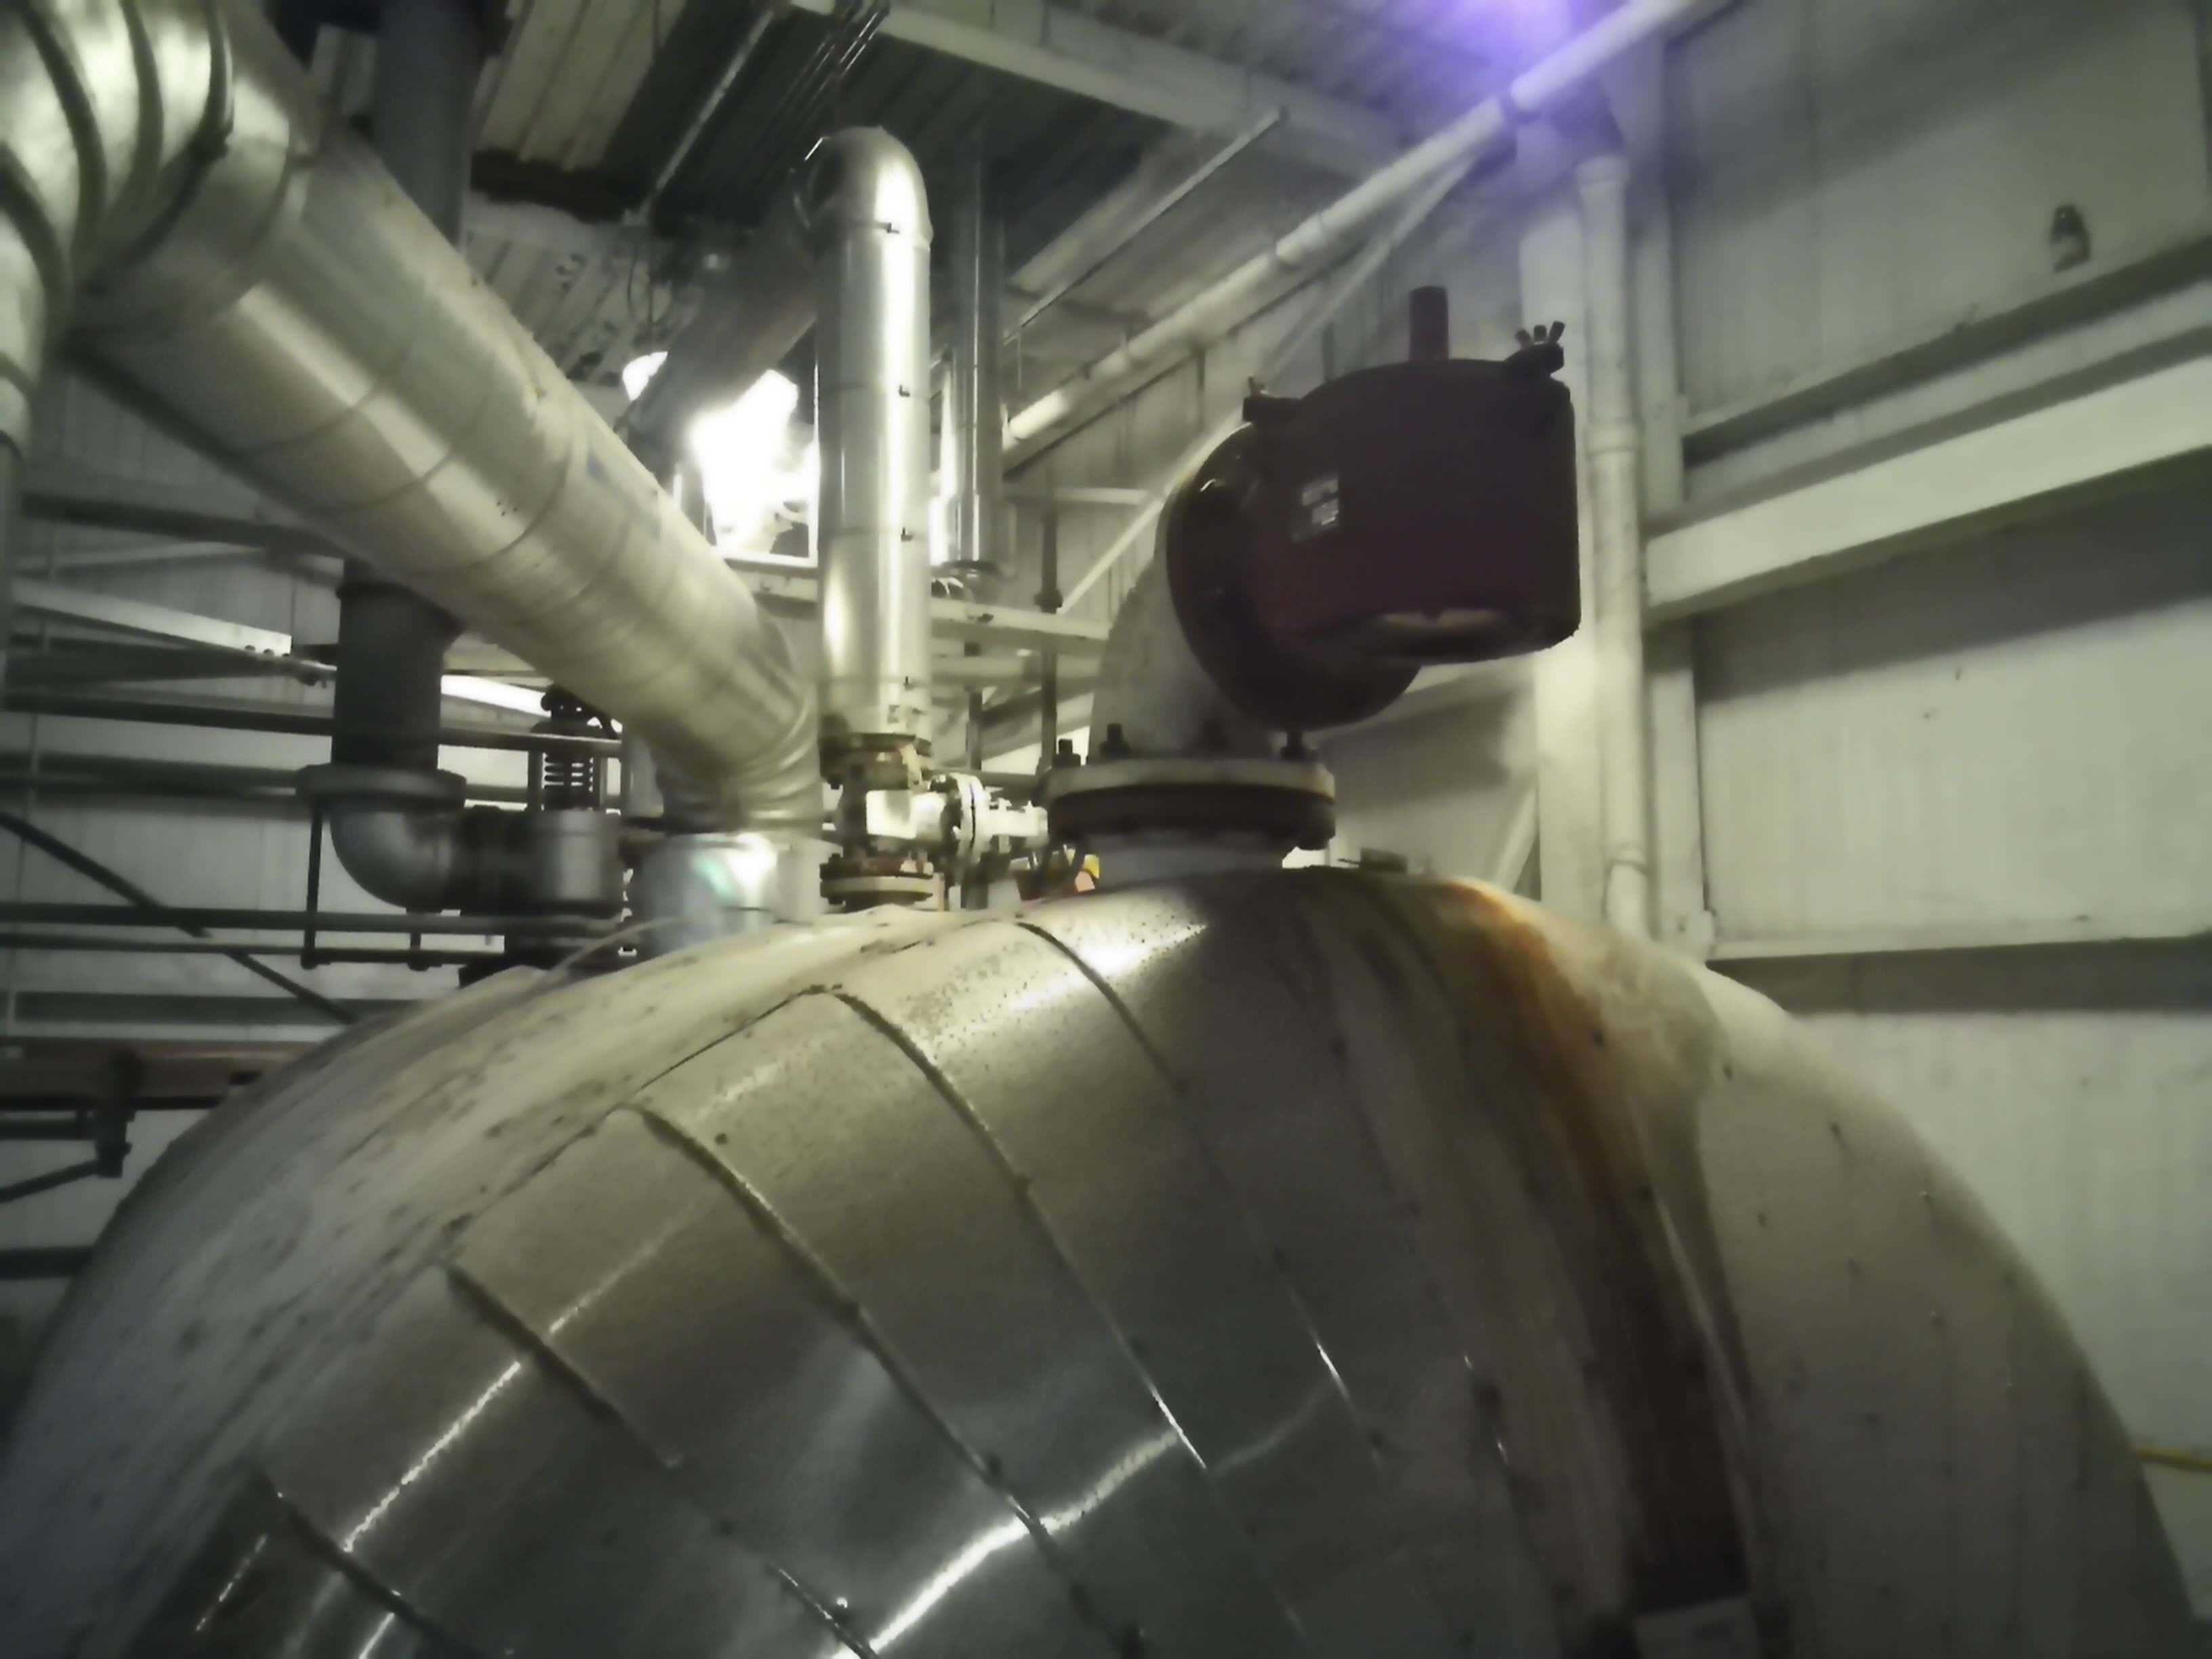
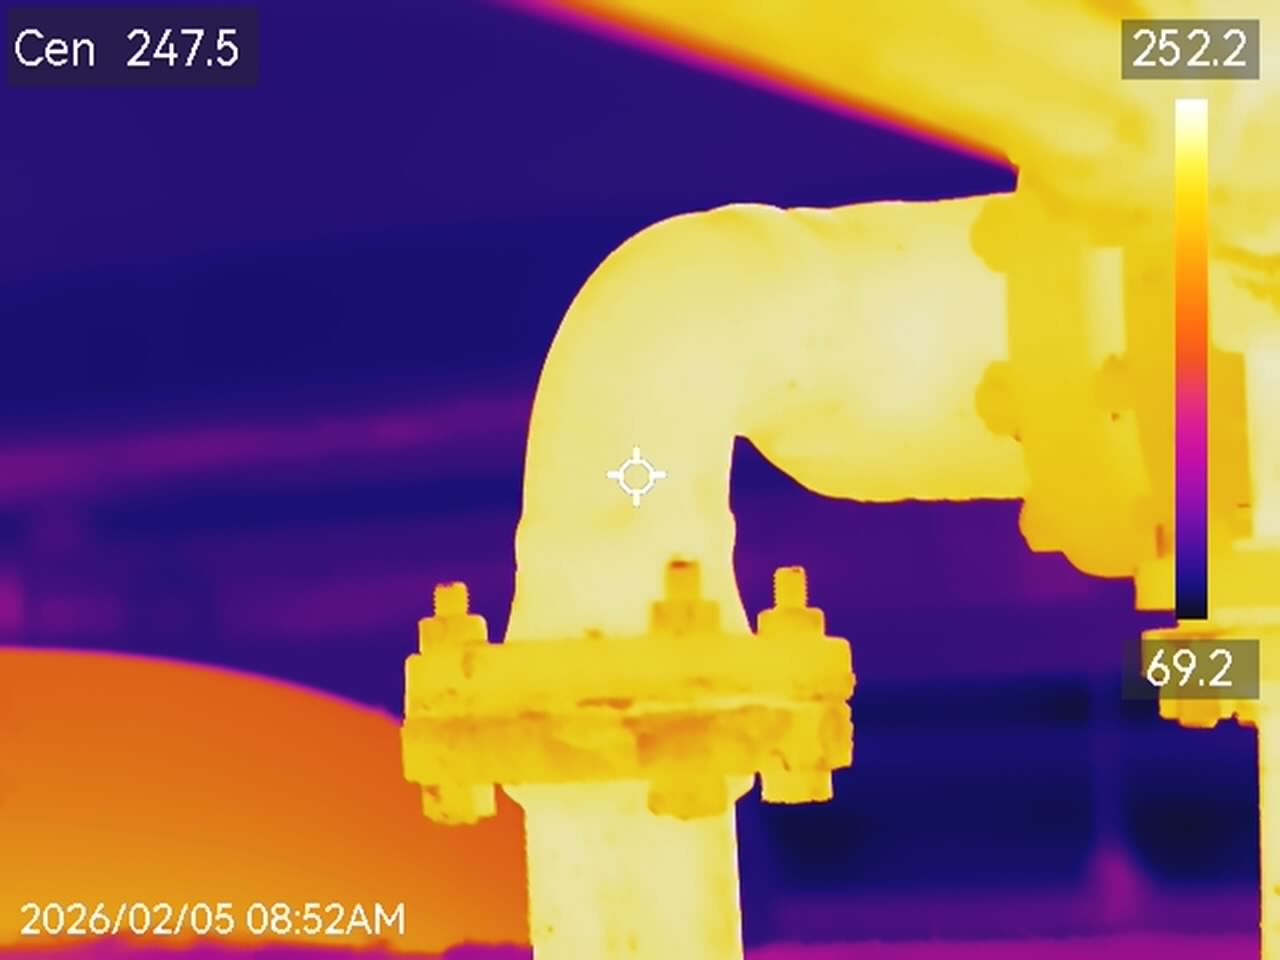
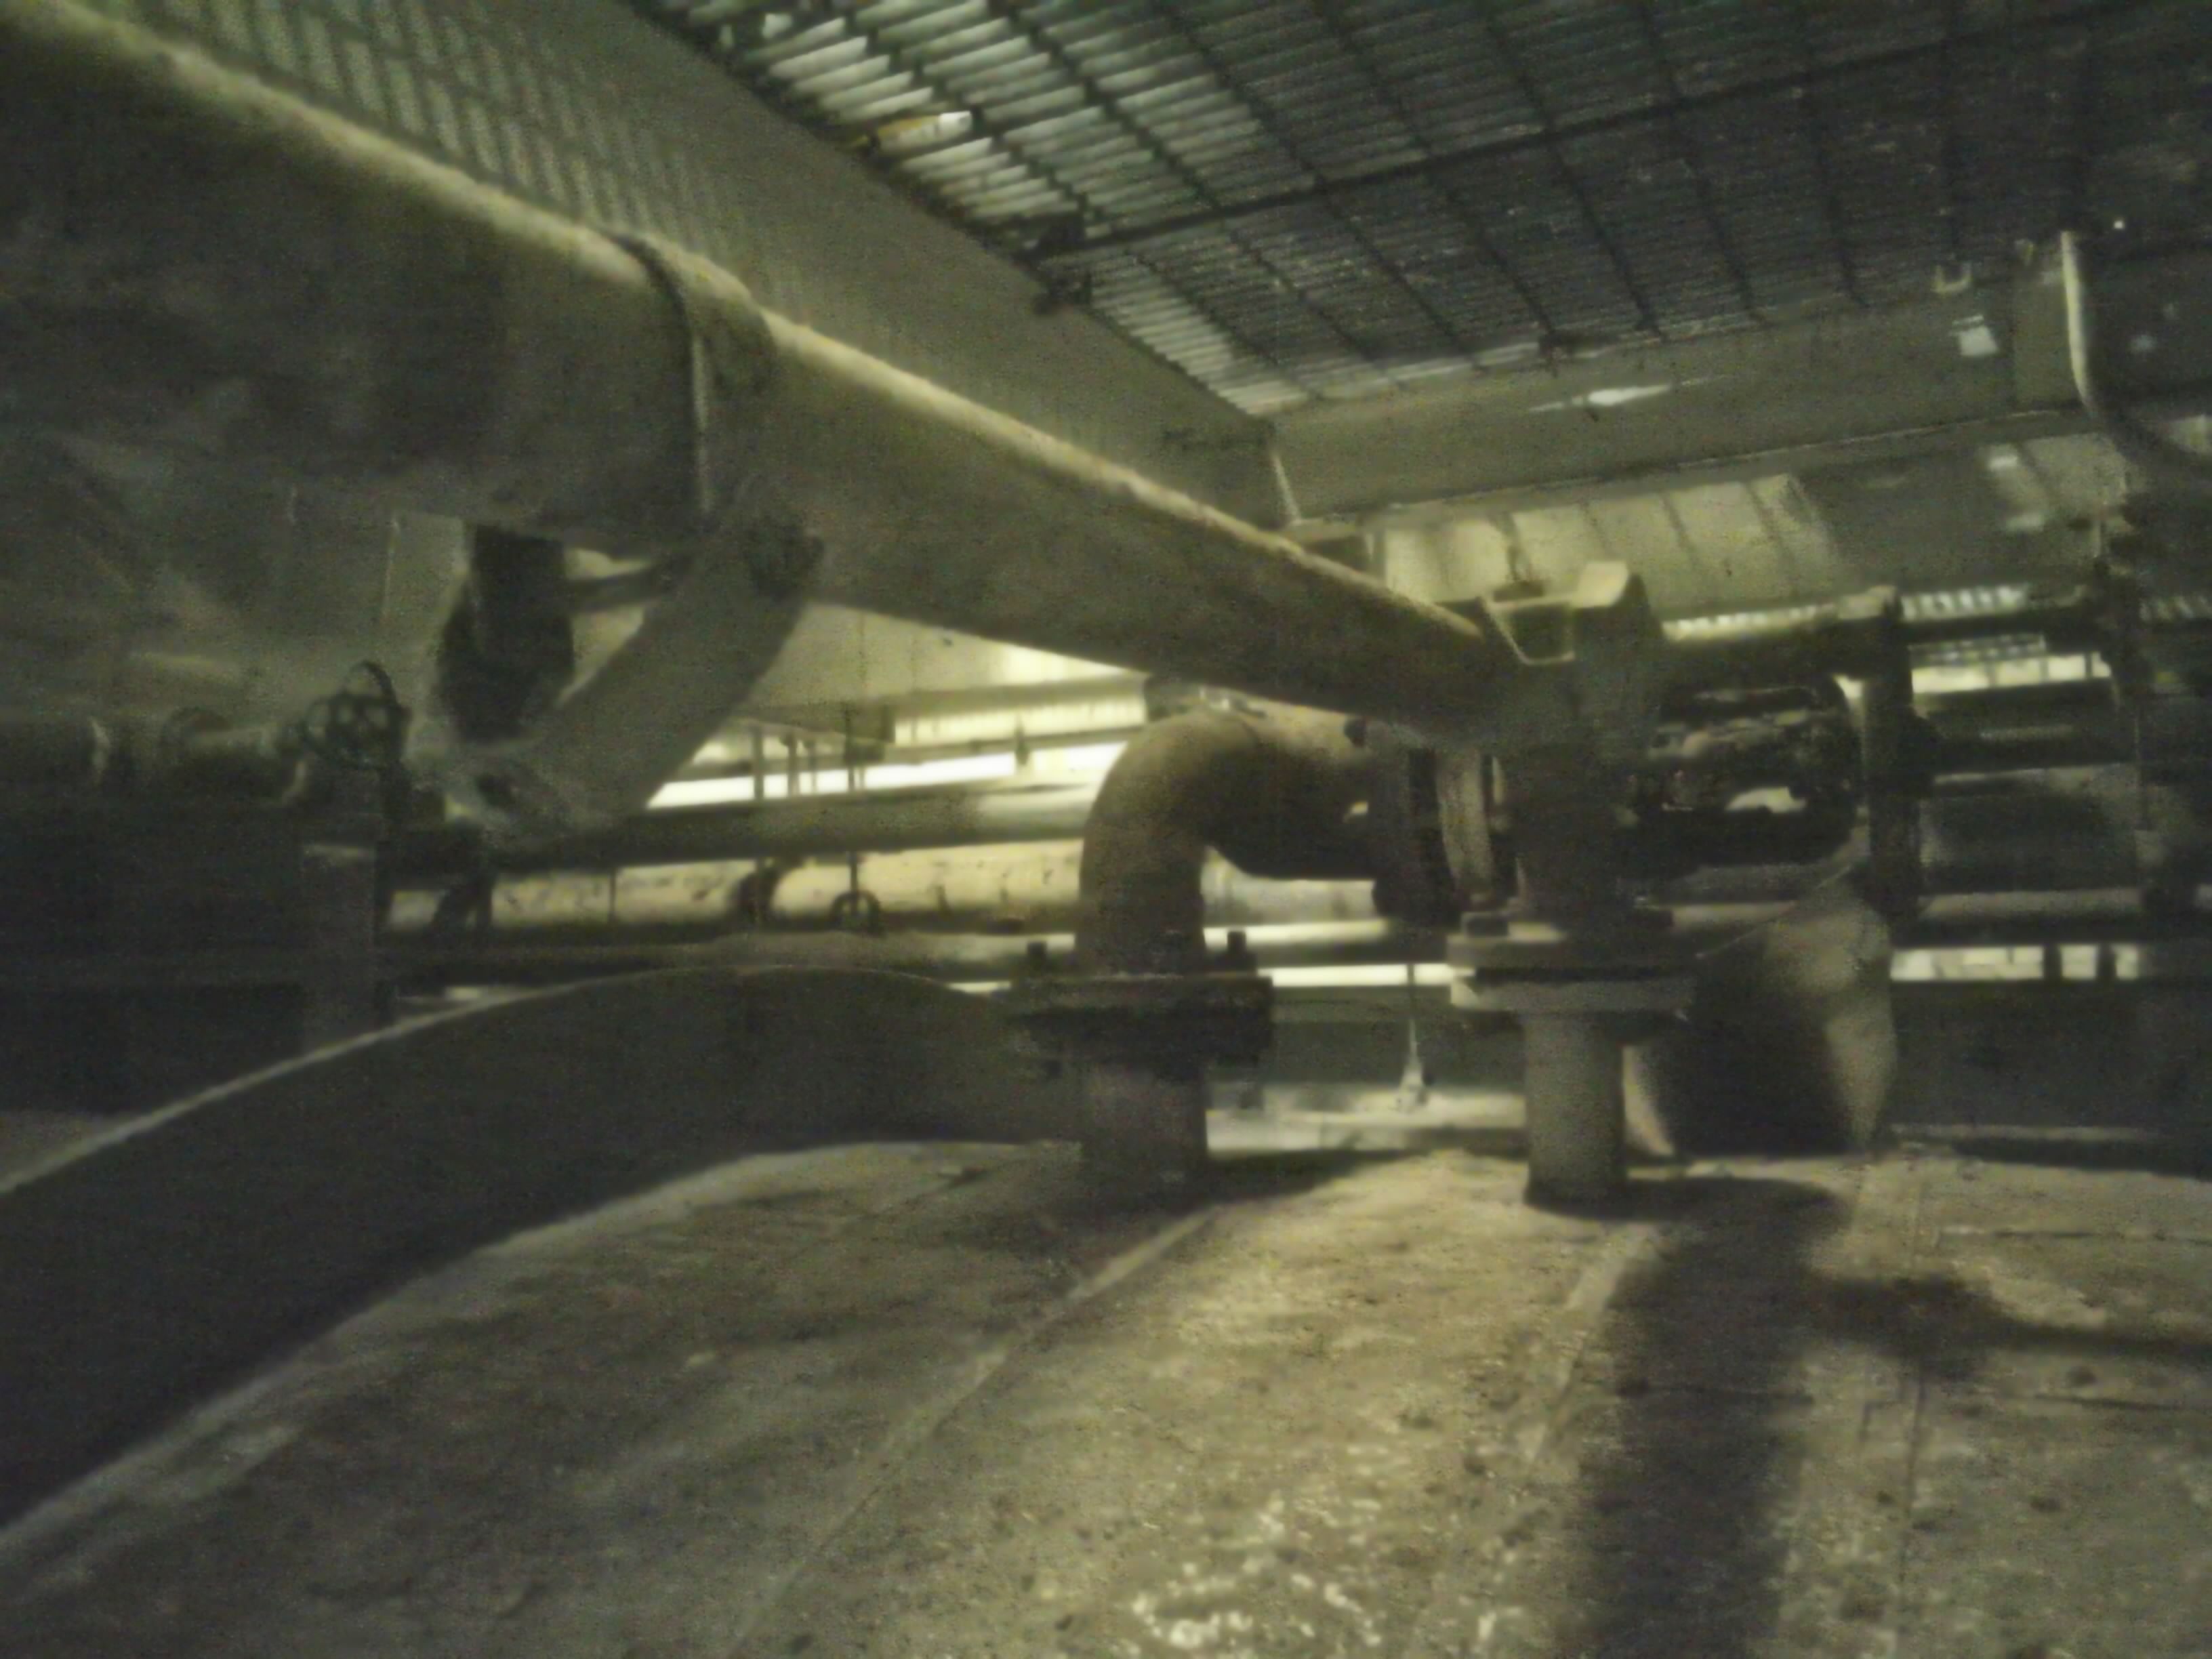
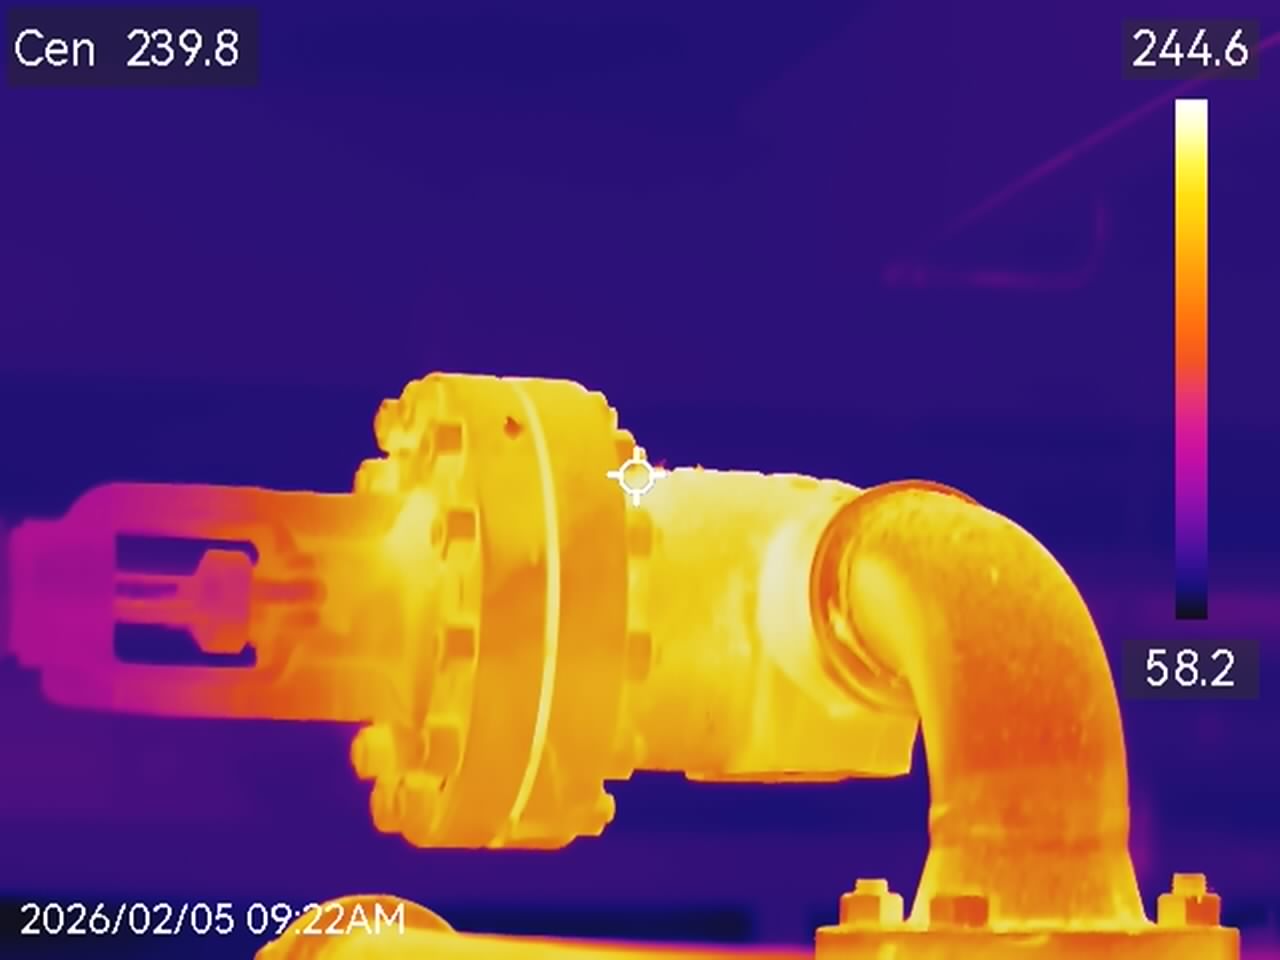
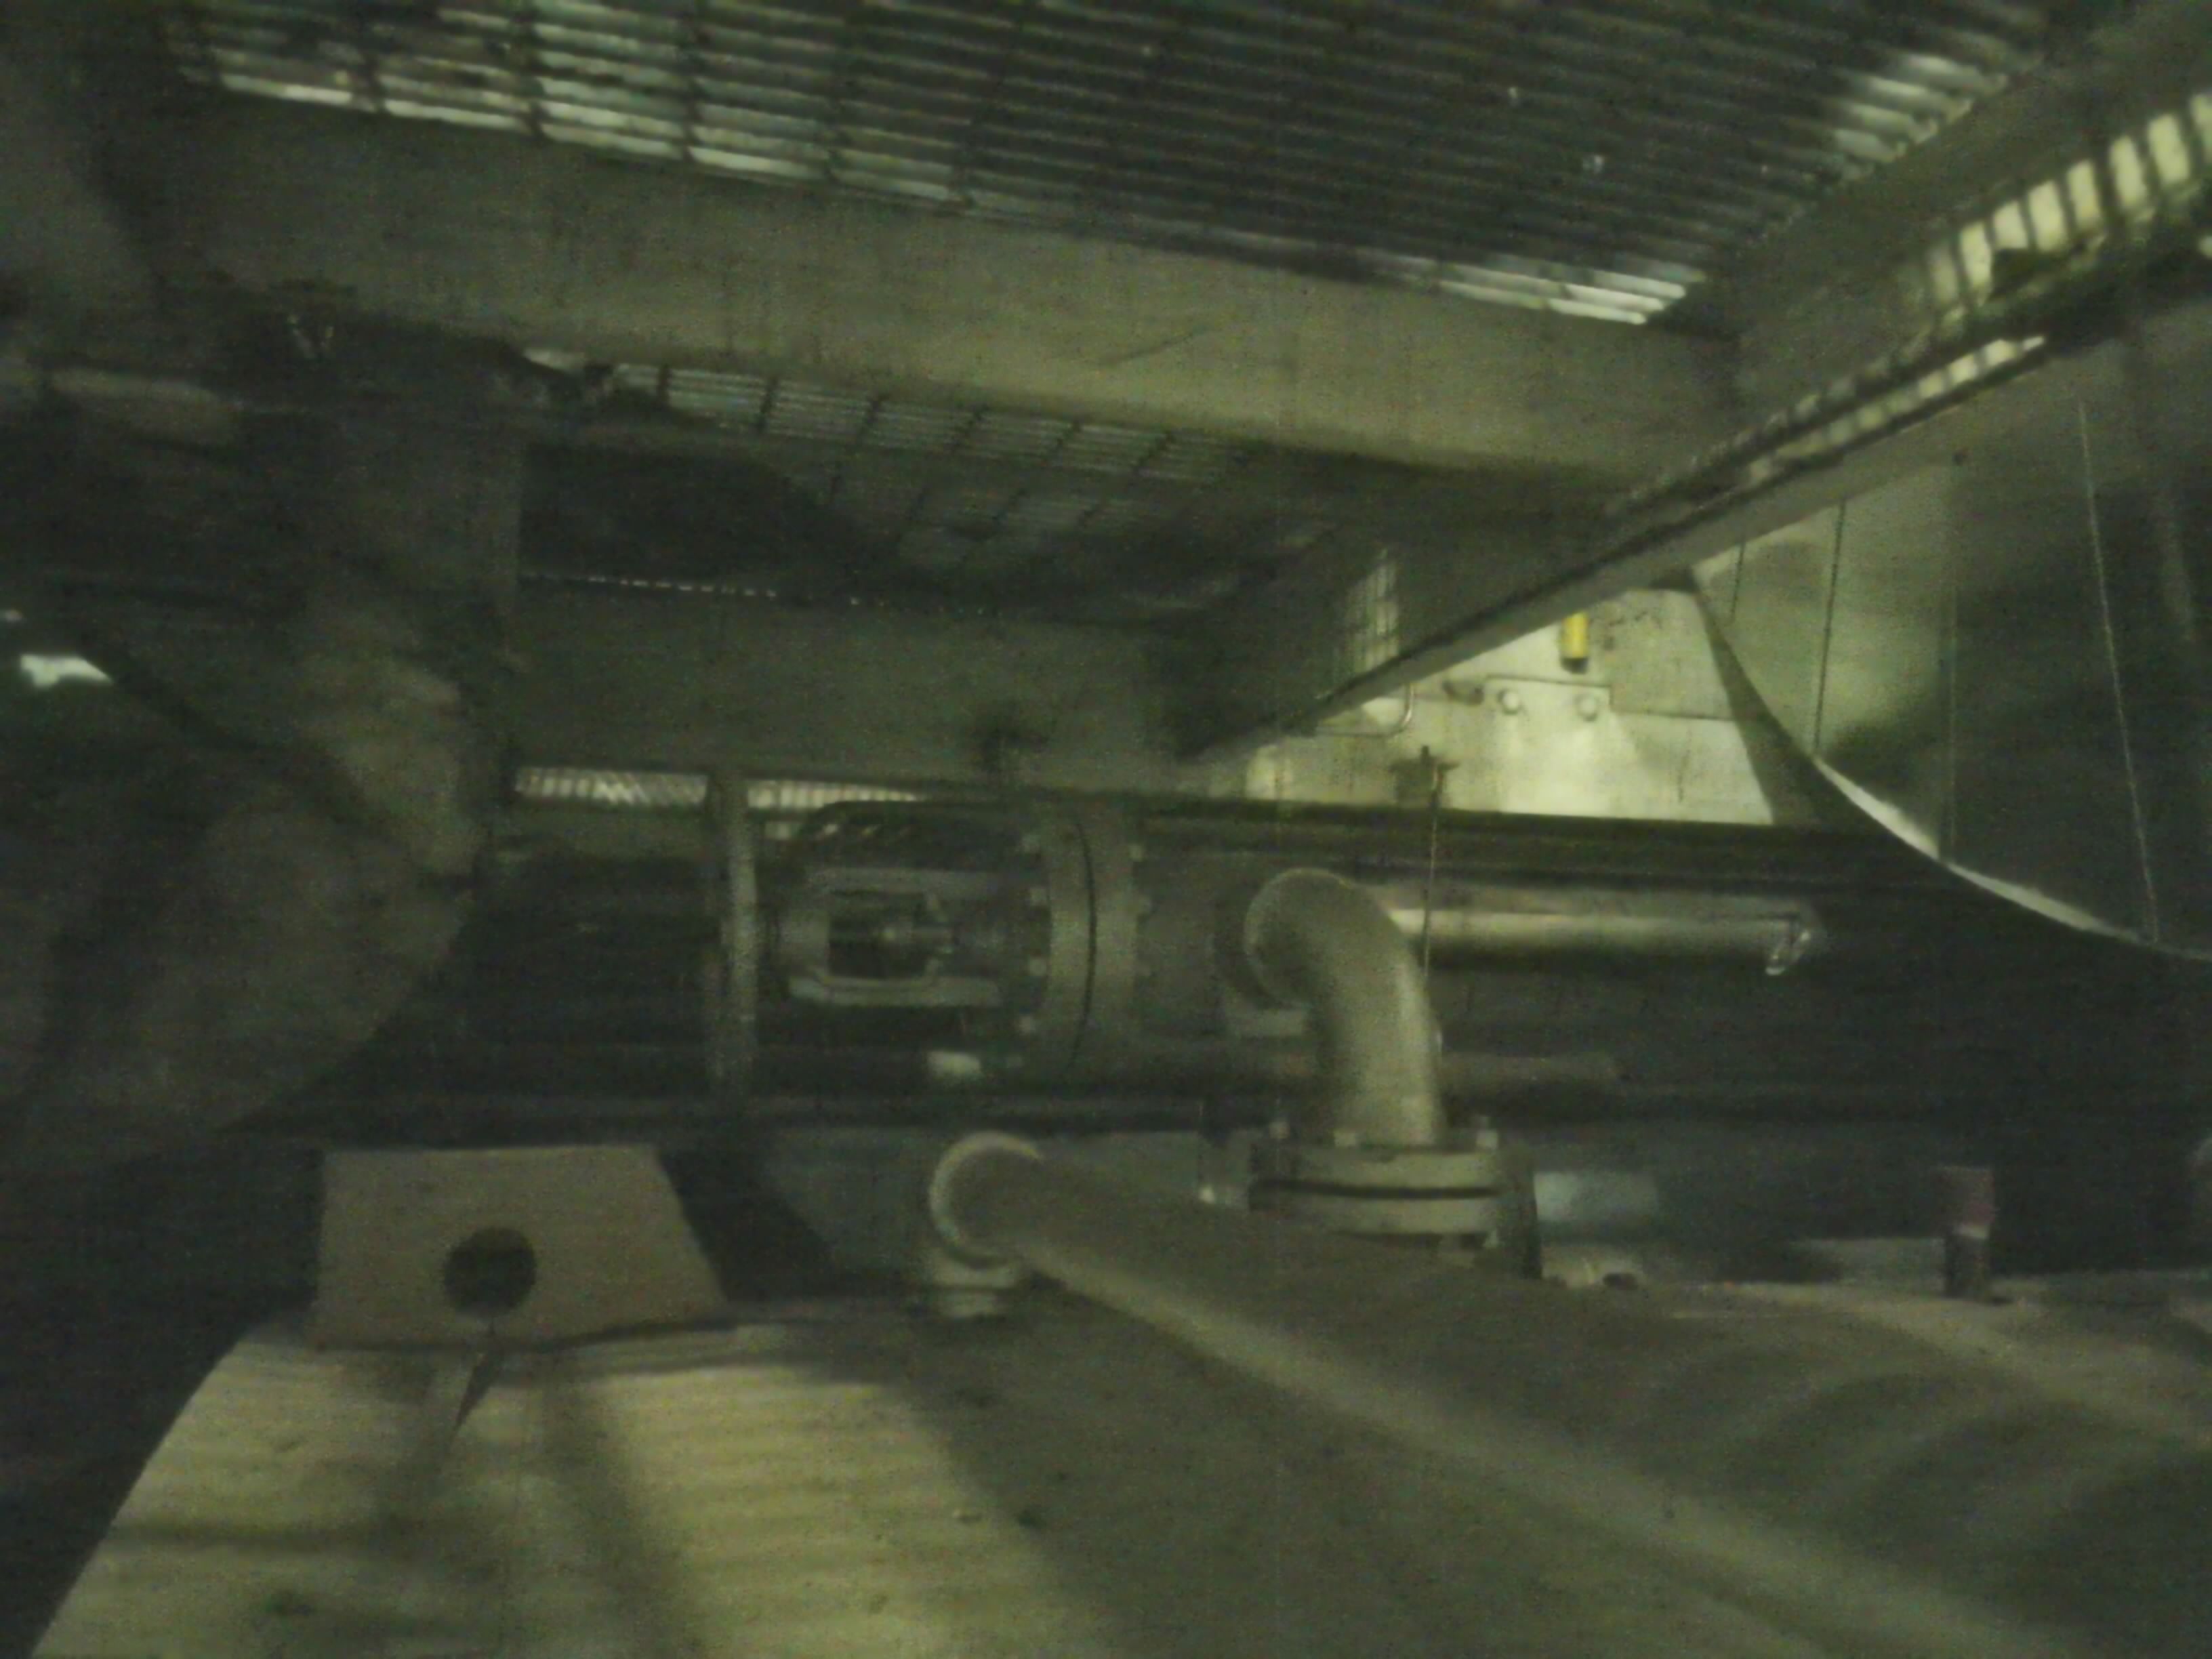
Infrared and visible-light photo pairs for each assessed equipment item.

STL 052

Flange · Lower/ Ground Level · Ref: 80
Infrared
IR: Ref 80 - IR
Ref 80 - IR
Visible
VIS: Ref 80 - VIS
Ref 80 - VIS

STL 053

90 Elbow · Lower/ Ground Level · Ref: 81
Infrared
IR: Ref 81 - IR
Ref 81 - IR
Visible
VIS: Ref 81 - VIS
Ref 81 - VIS

STL 054

Flange · Boiler room · Ref: 82
Infrared
IR: Ref 82 - IR
Ref 82 - IR
Visible
VIS: Ref 82 - VIS
Ref 82 - VIS

STL 055

Pipe · Lower/ Ground Level · Ref: 83
Infrared
IR: Ref 83 - IR
Ref 83 - IR
Visible
VIS: Ref 83 - VIS
Ref 83 - VIS

STL 056

Pump · Lower/ Ground Level · Ref: 85
Infrared
IR: Ref 85 - IR
Ref 85 - IR
Visible
VIS: Ref 85 - VIS
Ref 85 - VIS

STL 057

Boiler · Lower/ Ground Level · Ref: 86
Infrared
IR: Ref 86 - IR
Ref 86 - IR
Visible
VIS: Ref 86 - VIS
Ref 86 - VIS

STL 058

Manway · Lower/ Ground Level · Ref: 87
Infrared
IR: Ref 87 - IR
Ref 87 - IR
Visible
VIS: Ref 87 - VIS
Ref 87 - VIS

STL 059

Pipe · Lower/ Ground Level · Ref: 88
Infrared
IR: Ref 88 - IR
Ref 88 - IR
Visible
VIS: Ref 88 - VIS
Ref 88 - VIS

STL 062

Bonnet · Level 2 · Ref: 91
Infrared
IR: Ref 91 - IR
Ref 91 - IR
Visible
VIS: Ref 91 - VIS
Ref 91 - VIS

STL 063

Pipe · Level 2 · Ref: 93
Infrared
IR: Ref 93 - IR
Ref 93 - IR
Visible
VIS: Ref 93 - VIS
Ref 93 - VIS

STL 064

Bonnet · Level 2 · Ref: 94
Infrared
IR: Ref 94 - IR
Ref 94 - IR
Visible
VIS: Ref 94 - VIS
Ref 94 - VIS

STL 065

Expansion · Level 3 · Ref: 95
Infrared
IR: Ref 95 - IR
Ref 95 - IR
Visible
VIS: Ref 95 - VIS
Ref 95 - VIS

STL 066

Pipe · Level 2 · Ref: 99
Infrared
IR: Ref 99 - IR
Ref 99 - IR
Visible
VIS: Ref 99 - VIS
Ref 99 - VIS

STL 067

Flange · Level 2 · Ref: 101
Infrared
IR: Ref 101 - IR
Ref 101 - IR
Visible
VIS: Ref 101 - VIS
Ref 101 - VIS

STL 068

Pipe · Level 3 · Ref: 104
Infrared
IR: Ref 104 - IR
Ref 104 - IR
Visible
VIS: Ref 104 - VIS
Ref 104 - VIS

STL 069

Pipe · Level 2 · Ref: 105
Infrared
IR: Ref 105 - IR
Ref 105 - IR
Visible
VIS: Ref 105 - VIS
Ref 105 - VIS

STL 070

Bonnet · Upper Floor/ Grating · Ref: 107
Infrared
IR: Ref 107 - IR
Ref 107 - IR
Visible
VIS: Ref 107 - VIS
Ref 107 - VIS

STL 071

Pipe · Level 4 · Ref: 109
Infrared
IR: Ref 109 - IR
Ref 109 - IR
Visible
VIS: Ref 109 - VIS
Ref 109 - VIS

STL 072

Flange · Level 4 · Ref: 110
Infrared
IR: Ref 110 - IR
Ref 110 - IR
Visible
VIS: Ref 110 - VIS
Ref 110 - VIS

STL 073

Flange · Level 4 · Ref: 111
Infrared
IR: Ref 111 - IR
Ref 111 - IR
Visible
VIS: Ref 111 - VIS
Ref 111 - VIS

STL 074

Pipe · Level 4 · Ref: 112
Infrared
IR: Ref 112 - IR
Ref 112 - IR
Visible
VIS: Ref 112 - VIS
Ref 112 - VIS

STL 075

Pipe · Level 4 · Ref: 113
Infrared
IR: Ref 113 - IR
Ref 113 - IR
Visible
VIS: Ref 113 - VIS
Ref 113 - VIS

STL 076

Valve & Bonnet · Level 4 · Ref: 114
Infrared
IR: Ref 114 - IR
Ref 114 - IR
Visible
VIS: Ref 114 - VIS
Ref 114 - VIS
Parameters & Methodology

Project-specific inputs and calculation methodology.

Project Parameters
Boiler Efficiency80%
Hours of Operation8,300 hrs/yr
Ambient Temperature75 °F
Wind Speed0 mph
Fuel TypeNatural Gas
Fuel Cost$5.33/Mcf

Calculation Engine

All calculations performed using NAIMA 3E Plus (v5.1), based on ASTM C680 methodology.

Inventoried Condition

Each item assessed in as-found condition. Bare surfaces have no insulation present.

Upgraded Specification

Recommended upgrades include fiberglass, cellular foam, elastomeric, and ceramic fibre materials.

Emissions Methodology

CO₂ and NOₓ calculated using EPA fuel-specific emission factors applied to energy saved.